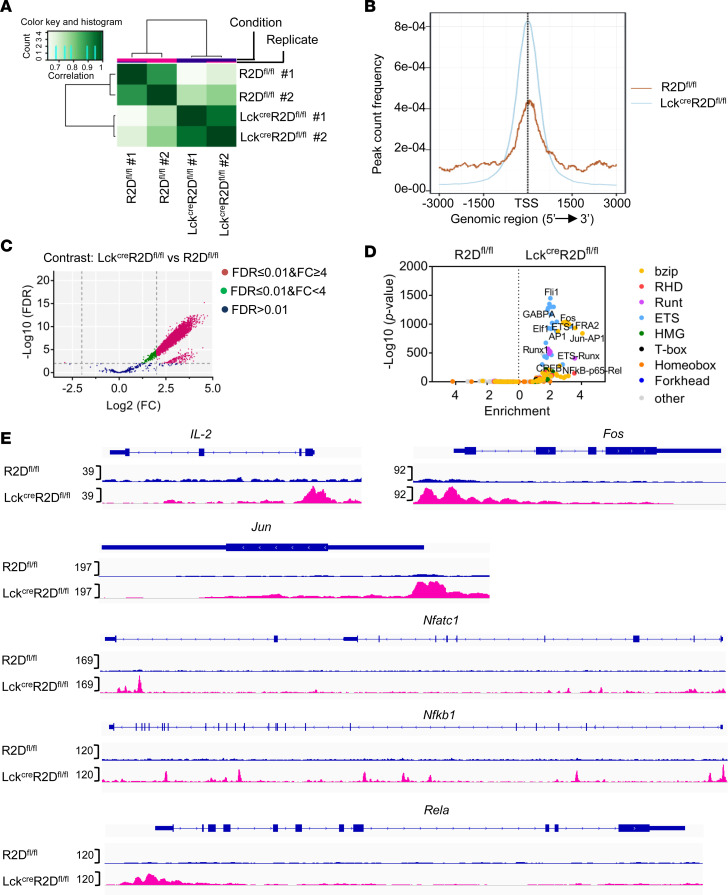
Figure 3. Chromatin accessibility profiles of Tconv cells with or without PPP2R2D expression using ATAC-seq analysis.
CD4+ Tconv cells were sorted out from spleens of R2Dfl/fl or LckCreR2Dfl/fl mice (n = 2 mice/group) and ex vivo stimulated by plate-bound CD3 and CD28 antibodies for 4 hours before being subjected to ATAC-seq. (A) Correlation heatmap indicating cross-correlation between each replicate or each group. (B) Histogram showing the distance from the nearest transcription start site (TSS) for all ATAC-seq peaks. (C) Volcano plot showing differential chromatin accessibility in CD4+ Tconv cells isolated from R2Dfl/fl (WT) and LckCreR2Dfl/fl (KO) mice. Fold change (FC) is calculated as log2 (LckCreR2Dfl/fl/R2Dfl/fl). Red indicates sites that were significantly different (adjusted P ≤ 0.01, FC ≥ 4). (D) Transcription factor (TF) family binding motifs enriched in loci more accessible in LckCreR2Dfl/fl or R2Dfl/fl Tconv cells; the x axis shows the enrichment factor (ratio of the percentage of differential sites with motifs to the percentage of nondifferential sites with motifs), and the y axis shows the significance level of enrichment. TF families are indicated by color. (E) Accessibility tracks for selected gene loci (IL-2, Fos, Jun, Nfatc1, Nfkb1, and Rela) in R2Dfl/fl (up) and LckCreR2Dfl/fl (down) Tconv cells were plotted using the integrative genomics viewer (IGV). ATAC-seq data are average of 2 biological replicates at each cell type.

