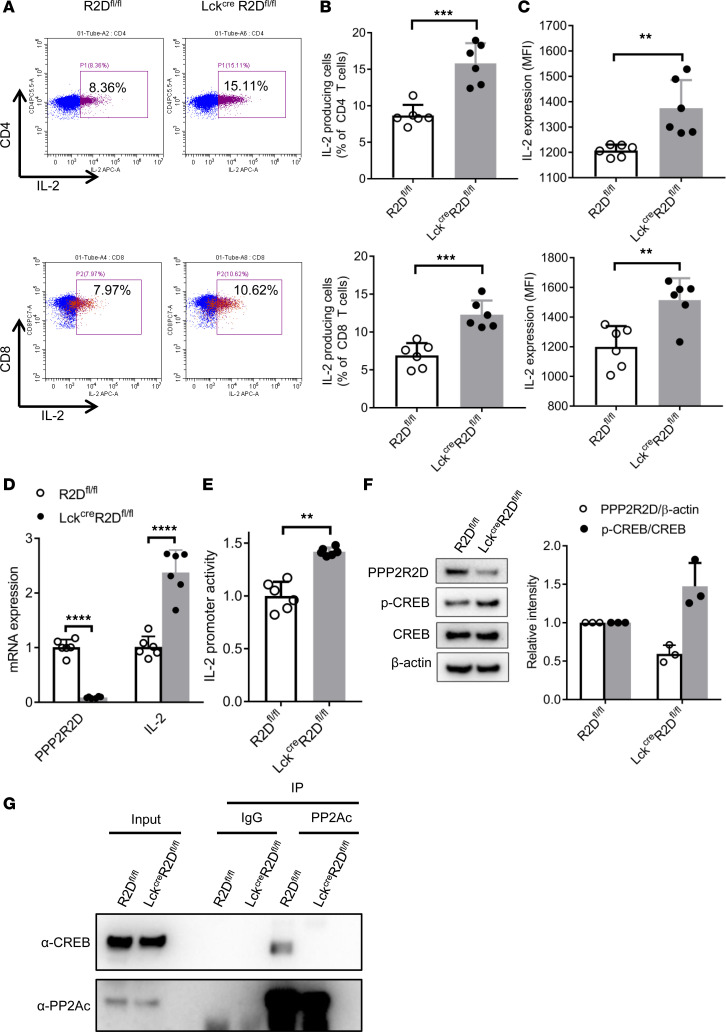
Figure 4. PPP2R2D deficiency enhances IL-2 production by T cells.
Splenic CD4+ or CD8+ T cells were isolated from R2Dfl/fl and LckCreR2Dfl/fl mice. (A–C) Splenic CD4+ or CD8+ T cells were stimulated with phorbol myristate acetate (PMA)/ionomycin and brefeldin A for 4 hours before subjected to FACS analysis of intracellular staining of IL-2 production. Representative flow cytometry plots were shown in A. Cumulative data (n = 6 mice/group) from individual mice depicting the percentages of IL-2–producing cells (B) and the expression of IL-2 (C) were presented. MFI, mean fluorescence intensity. (D) The mRNA expression level of PPP2R2D and IL-2 in R2Dfl/fl and LckCreR2Dfl/fl T cells. Splenic CD4+ T cells were stimulated with plate-bound anti-CD3 and anti-CD28 for 6 hours before extraction of RNA for quantitative PCR analysis. Data are shown as n = 3 mice/group with 2 technical replicates for each mouse. (E) The promoter activity of IL-2 in R2Dfl/fl and LckCreR2Dfl/fl T cells. Splenic CD4+ T cells were nucleofected with IL-2 promoter by using Amaxa Nucleofector electroporation, rested overnight, and stimulated with plate-bound anti-CD3 and anti-CD28 for 24 hours before measurement of luciferase activity. Data are shown as n = 3 mice/group with 2 technical replicates for each mouse. (F and G) Splenic CD4+ T cells were stimulated with plate-bound anti-CD3 and anti-CD28 for 6 hours. (F) Western blot analysis of PPP2R2D, p-CREB, CREB, and β-actin in T cells. Representative immunoblots and cumulative data (n = 3 mice/group, right) are presented. (G) Co-IP analysis of PP2AC and CREB in T cells. The blot is representative of 3 independent experiments. **P < 0.01, ***P < 0.001, ****P < 0.001 using unpaired t test.

