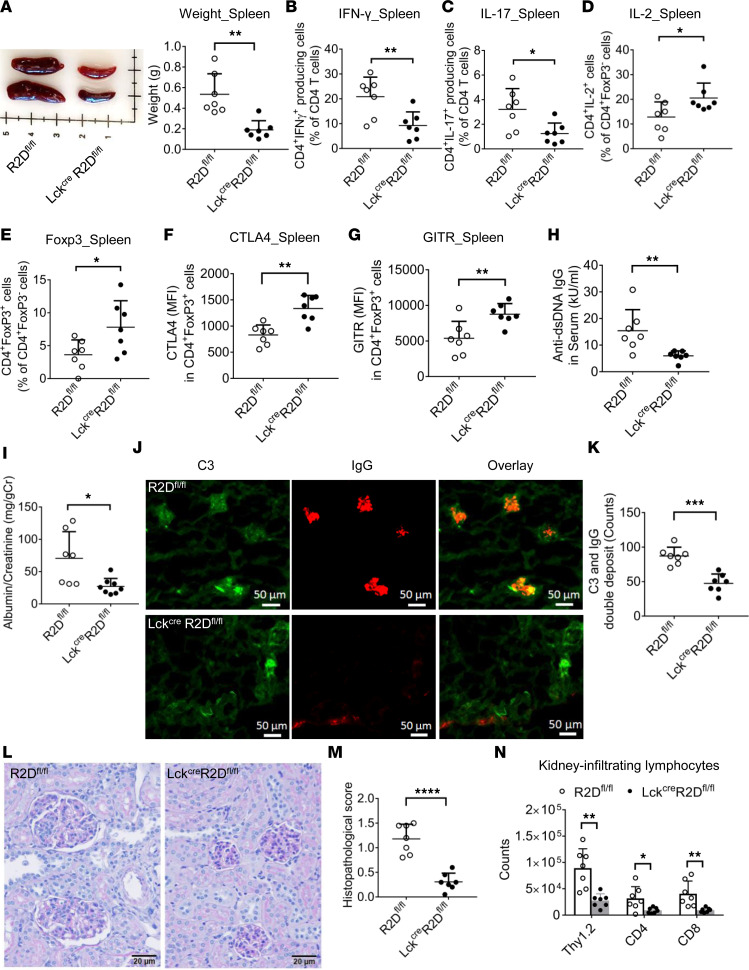
Figure 5. PPP2R2D deficiency in T cells mitigates imiquimod-induced lupus-like pathology in mice.
Topical imiquimod was applied to the ear skin of R2Dfl/fl and LckCreR2Dfl/fl mice (n = 7/group) for 8 weeks. (A) The representative picture and cumulative data of the weight of spleens. FACS analysis of the percentage of CD3+CD4+IFN-γ+ (B), CD3+CD4+IL-17A+ (C), CD3+CD4+IL-2+ (D), and CD3+CD4+FoxP3+ (E) cells in spleens. (F and G) The expression levels of Treg markers CTLA-4 (F) and GITR (G) in splenic Tregs (CD3+CD4+FoxP3+) were determined by FACS. (H and I) The anti-dsDNA IgG level in serum (H) and the levels of albumin and creatinine in urine (I) were measured by ELISA. (J and K) The deposition of complement 3 (C3) and IgG in glomeruli was determined by immunofluorescence staining. Representative figures (J) and cumulative data (K) depicting numbers of glomeruli with C3 and IgG double deposition in coronal sections of kidney. Scale bar: 50 μm. (L) Representative H&E staining of kidney tissues. Scale bar: 20 μm. (M) Cumulative data elucidating the histopathologic scores for glomerulonephritis. (N) Kidney-infiltrating lymphocytes including total T cells (Thy1.2), CD4+ T cells, and CD8+ T cells were counted and analyzed by FACS. *P < 0.05, **P < 0.01, ***P < 0.001, ****P < 0.001 using unpaired t test.

