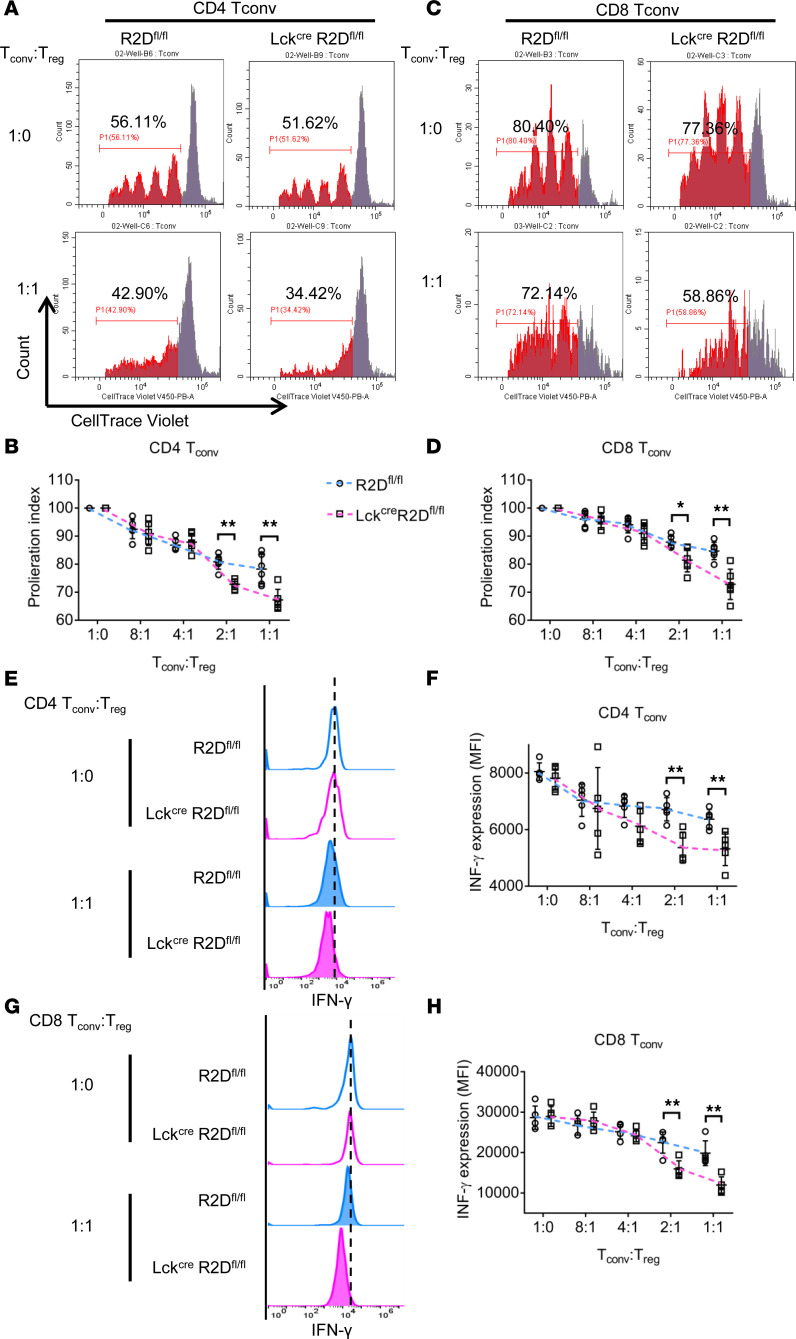
Figure 6. Loss of PPP2R2D expression in T cells enhances the suppressive capacity of Tregs.
In vitro suppression of R2Dfl/fl or LckCreR2Dfl/fl CD4+ Tconv or CD8+ Tconv cells by R2Dfl/fl or LckCreR2Dfl/fl Tregs after incubation together at various ratios. (A–D) Proliferation index of CD4+ Tconv (A and B) or CD8+ Tconv (C and D) cells is shown. Representative flow charts of the dilution of fluorescent dye CellTrace Violet (A and C) and cumulative data (B and D) are shown. n = 6 mice/group. (E–H) Expression of IFN-γ in CD4+ Tconv (E and F) or CD8+ Tconv (G and H) cells is shown. Representative flow charts of the expression of IFN-γ (E and G) and cumulative data (F and H) are shown. n = 5 mice/group. *P < 0.05, **P < 0.01 using multiple t test.

