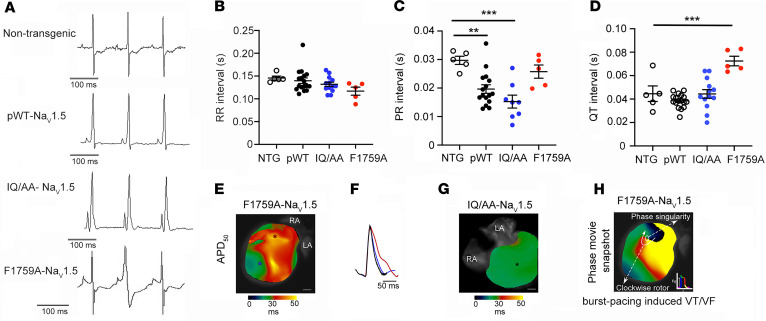
Figure 3. QT interval and ventricular repolarization is not prolonged in IQ/AA transgenic mice.
(A) Representative limb-lead surface electrocardiograms of isoflurane-anesthetized littermate nontransgenic, pWT, IQ/AA, and F1759A transgenic mice. (B–D) Bar graphs of RR, PR, and QT intervals from isoflurane-anesthetized mice. Mean ± SEM. For RR interval, P= 0.12; for PR interval, P = 0.0004; for QT interval, P < 0.001 by 1-way ANOVA. **P < 0.01, ***P < 0.001 by Dunnett’s multiple comparison test. NTG, n = 5; pWT, n = 17; IQ/AA, n = 13; F1759A, n = 5. (E–G) Representative optical APD maps (E and G) and optical action potential tracings (F) from F1759A and IQ/AA mice. APD maps for F1759A-dTG were obtained after hyperkalemia-induced conversion to sinus rhythm. The circles in panels E and G mark the regions for which optical action potential tracings are displayed in F. Scale bar: 1 mm. Representative of 3 similar recordings. (H) Snapshot from phase movie of Langendorff-perfused F1759A-dTG hearts demonstrating rotor in the ventricle after burst pacing–induced ventricular arrhythmia. Representative of 3 similar experiments.

