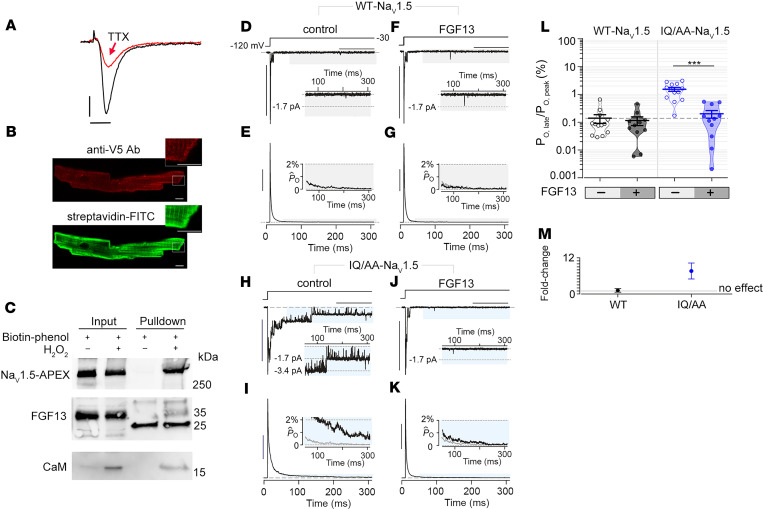
Figure 4. Expression of FGF13 reduces late Na+ current in IQ/AA NaV1.5.
(A) Exemplar whole cell Na+ currents recorded from cardiomyocytes of TTX-sensitive NaV1.5-V5-APEX2 transgenic mice, before (black trace) and after (red trace) 20 nM TTX. Representative of 3 similar recordings. Vertical scale bar: 5 pA/pF; horizontal scale bar: 5 ms. (B) Immunofluorescence of cardiomyocytes isolated from mice expressing NaV1.5-V5-APEX2 exposed to biotin-phenol and H2O2. Staining is with anti-V5– and –Alexa 594–conjugated secondary antibodies (upper) and streptavidin-conjugated Alexa 488. Scale bar: 5 μm. (C) Immunoblots of biotin-labeled proteins from cardiomyocytes of NaV1.5-APEX2 mice. NaV1.5, FGF13, and CaM are detected in streptavidin pull-down. Blots are representative of 2 independent experiments. (D and E) Multichannel recordings show minimal late Na+–channel openings for WT-NaV1.5 expressed in HEK293 cells. Format as in Figure 2, F and G. Horizontal scale bar: 100 ms; vertical scale bar: 10 pA (D) and 25% for normalized PO (PO[t]/PO,peak) (E). (F and G) Late current of WT-NaV1.5 is unaffected by FGF13 overexpression. Same format as in D and E. (H and I) IQ/AA NaV1.5 mutant channel showing enhanced late-channel openings compared with WT-NaV1.5 in HEK293 cells. Same format as in D and E. (J and K) FGF13 coexpression with IQ/AA NaV1.5 reverses the increase in late current to WT levels. Same format as in D and E. (L) Dot plot summary of PO,late for WT-NaV1.5 and IQ/AA NaV1.5 in the presence and absence of FGF13. Mean ± SEM, ***P < 0.0001 by Kruskal-Wallis test with Dunn’s multiple comparison test. (M) Graph shows fold-change in PO,late for WT-NaV1.5 and IQ/AA NaV1.5 by FGF13. Mean ± SEM, computed from aggregate data in L.

