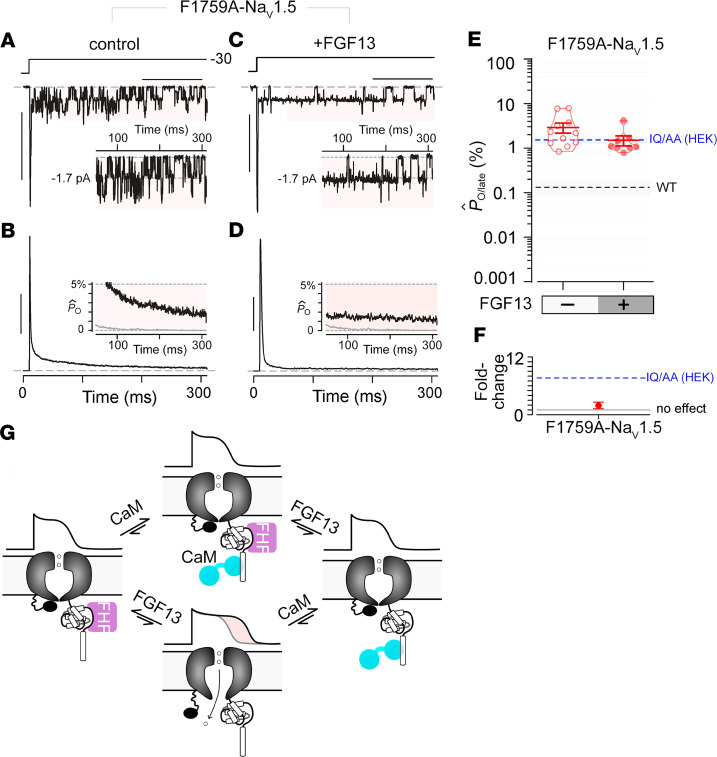
Figure 5. Late Na+ current for F1759A-NaV1.5 is minimally perturbed by FGF13.
(A and B) Multichannel recordings show high late Na+ current for F1759A-NaV1.5 mutant when expressed in HEK293 cells. Format as in Figure 2, F and G. Horizontal scale bar: 100 ms; vertical scale bar: 10 pA (A) and 25% for normalized PO (PO[t]/PO,peak) (B). (C and D) FGF13 coexpression with F1759A-NaV1.5 mutant. Horizontal scale bar: 100 ms; vertical scale bar:10 pA (C) and 25% for normalized PO (PO[t]/PO,peak) (D). (E and F) Population data confirm minimal change in late PO for F1759A-NaV1.5 with FGF13. Format as in Figure 4, L and M. Open probability of late Na+ current from heterologously expressed IQ/AA NaV1.5 (without FHF13) is shown by the dashed blue line. (G) Schematic depicting late Na+ current in the absence of both FGF13 and CaM binding to the C-terminal domain of NaV1.5. Late Na+ current is not present when either FHF or CaM binds to the C-terminal domain of NaV1.5.

