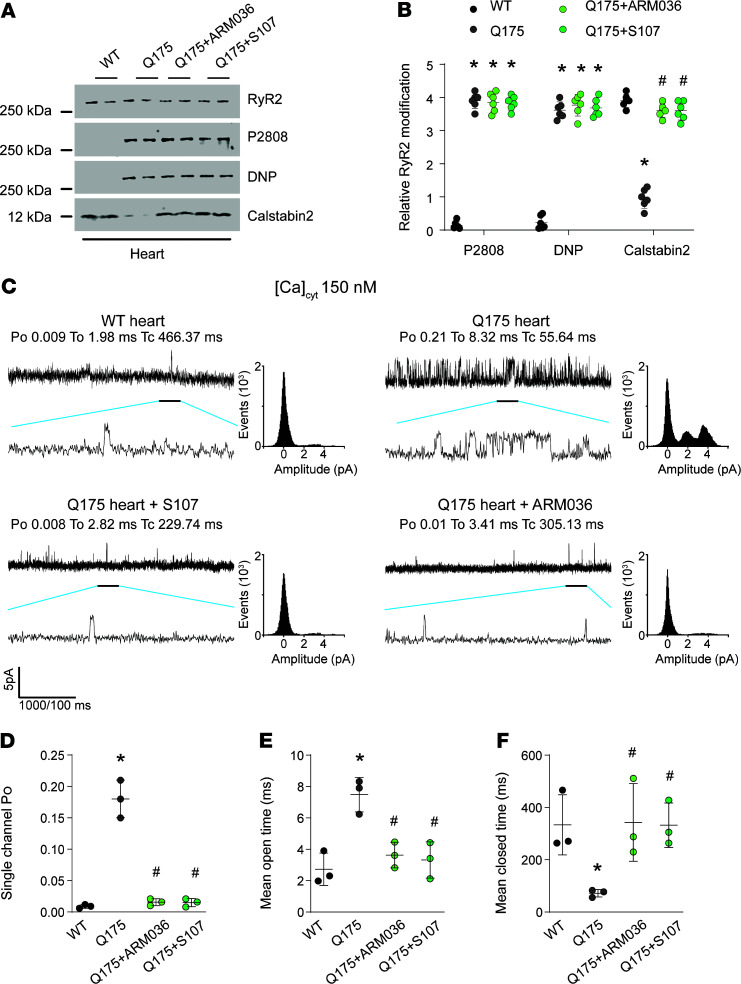
Figure 5. Cardiac RyR2 remodeling in Q175 mice.
(A and B) Representative SDS-PAGE analysis and quantification of RyR2 immunoprecipitated from the heart samples from WT (n = 6), Q175 (n = 6), Q175+ARM036 (n = 6), and Q175+S107 (n = 6) (bands’ intensities were normalized to total RyR2). (C) Single-channel traces of RyR2 incorporated in planar lipid bilayers with 150 nM Ca2+ in the cis chamber, corresponding to representative experiments performed with heart samples from WT, Q175, Q175+ARM036, and Q175+S107 mice. (D–F) Single-channel analysis: PO was 0.009 ± 0.001 in WT (n = 3) and in Q175 mice increased to 0.18 ± 0.01 (n = 3) and restored by S107 treatment to 0.015 ± 0.003 (n = 3) and ARM036 to 0.015 ± 0.003 (n = 3). Data (mean ± SD) analysis was performed by 1-way ANOVA. Bonferroni’s posttest revealed *P < 0.05 vs. WT, #P < 0.05 vs. Q175.

