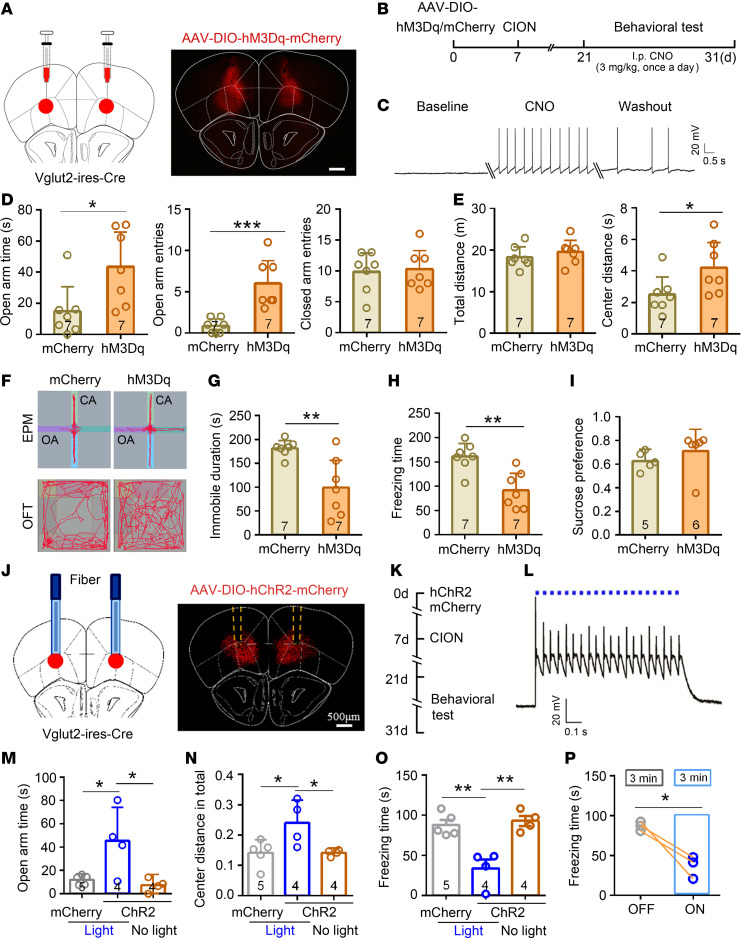
Figure 5. Selective activation of VLO glutamatergic neurons produced an antianxiodepressive effect in TN mice.
(A) Schematic and photomicrograph of coronal section showing AAV-DIO-hM3Dq-mCherry injection into the bilateral VLO of Vglut2-IRES-Cre mice. Scale bar: 500 μm. (B) Schematic of the protocol for experiments D–I. (C) An example showing that bath CNO (500 nM) evoked action potentials (APs) in VGLUT2+ neurons expressing hM3Dq-mCherry. (D–H) Activation of bilateral VLO VGLUT2+ neurons by chemogenetic manipulation produced an antianxiodepressive effect in EPM and OFT (D–F), FST (G), and TST (H). *P < 0.05, **P < 0.01, ***P < 0.001, 2-sided Student’s t test; n = 7 (both mCherry and hM3Dq). (I) Activation of bilateral VLO VGLUT2+ neurons by chemogenetic manipulation did not affect sucrose presence in SPT (2-sided Student’s t test; n = 5 mCherry and 6 hM3Dq). (J) Schematic and photomicrograph of coronal section showing the site of optical fiber implantation and AAV-DIO-hChR2-mCherry injection into the bilateral VLO of Vglut2-IRES-Cre mice. Scale bar: 500 μm. (K) Schematic of the protocol for experiments in M–P. (L) Patch clamp recording in VLO slice showing that action potentials induced through blue light stimulation (473 nm, 5 mW, 20 Hz) on VLO VGLUT2+ neurons expressing ChR2-mCherry. (M–O) Optogenetic activation of bilateral VLO VGLUT2+ neurons produced an antianxiodepressive effect in EPM (M), OFT (N), and TST (O). *P < 0.05, **P < 0.01, 1-way ANOVA followed by post hoc Student-Newman-Keuls test; n = 5 (mCherry-light), 4 (ChR2-light), and 4 (ChR2-no light). (P) Blue light stimulation of VLO VGLUT2+ neurons expressing ChR2-mCherry reduced the freezing time in TST with lights on for 3 minutes. *P < 0.05, 2-sided paired t test; n = 3 (ChR2-light off and light on).

