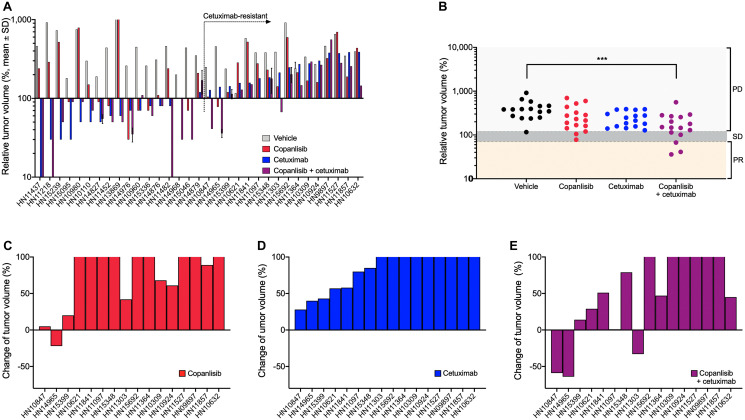
Figure 1. In vivo antitumor efficacy of copanlisib and cetuximab in the panel of HNSCC PDX models.
(A) NMRI nu/nu or NOG (for HN15239) mice bearing HNSCC xenografts (n = 33) were treated with copanlisib (intravenously at 10 mg/kg, 2on/5off) and/or cetuximab (intravenously at 50 mg/kg, once weekly) for three weeks. (B–E) Tumor growth in the cetuximab-resistant HNSCC PDX models (n = 16) described in panel (A). Relative tumor volume (A–B) and change of tumor volume (C–E) are calculated from the difference of tumor size at the end of the treatment period compared to the initial tumor size (at the time point of starting treatment) of each individual animal. PR, partial response; SD, stable disease; and PD, progressive disease. Asterisks indicate statistical significance, p < 0.001.

