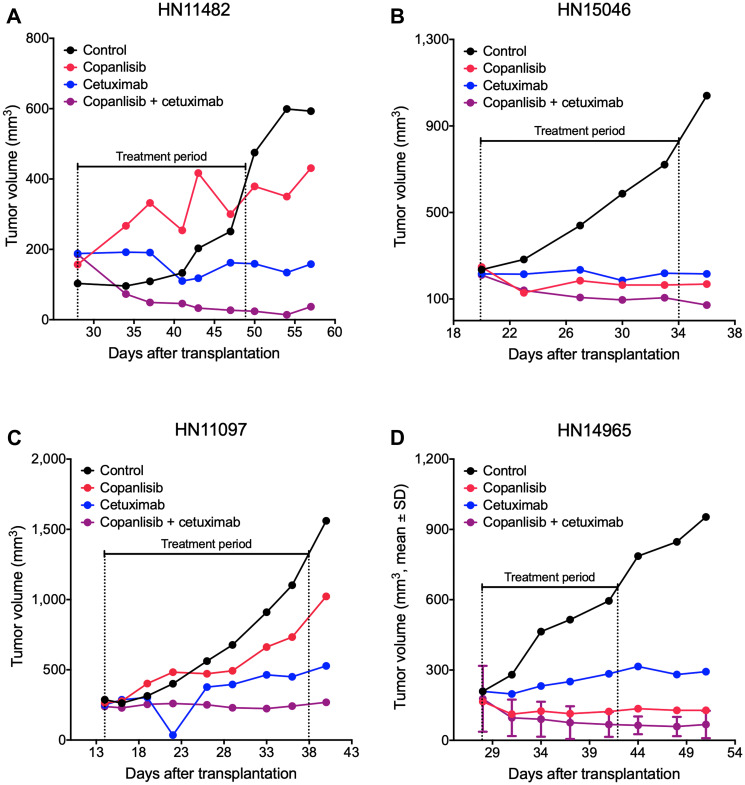
Figure 2. Representative tumor growth curves from the panel of HNSCC PDX models.
NMRI nu/nu mice bearing cetuximab-sensitive HN11482 (A) and HN15046 (B) or cetuximab-resistant HN11097 (C) and HN14965 (D) xenografts were treated with copanlisib (intravenously at 10 mg/kg, 2on/5off) and/or cetuximab (intravenously at 50 mg/kg, once weekly) for three weeks. Tumor volume was measured twice weekly. HN14965 (D) represents an HPV-positive model (n = 2).

