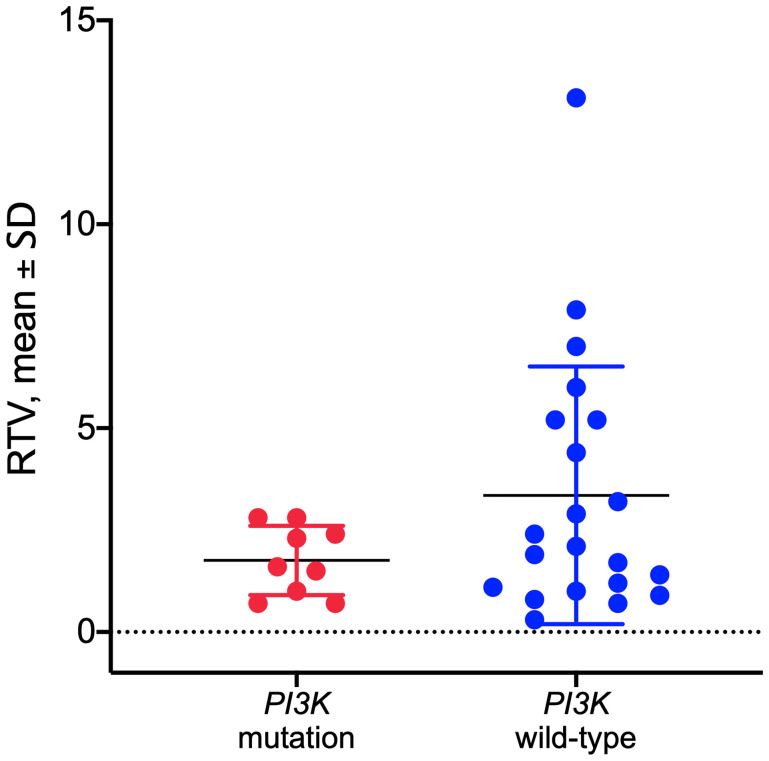
Figure 3. Response to copanlisib expressed as relative tumor volume (RTV) in HNSCC PDX models with mutated or wild-type PI3K gene.
No correlation was observed between the PI3K mutational status and response to copanlisib (p = 0.1516, unpaired t-test). Data are expressed as dot plots with each dot representing individual PDX model with mean and SD represented by horizontal lines.

