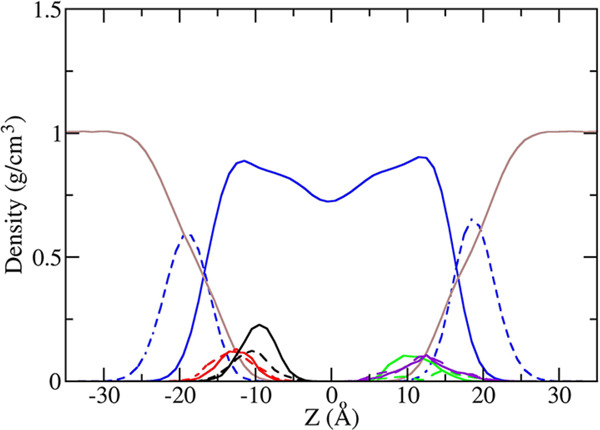
Figure 1.
Density profiles of Ace-Phe-Leu-NMe and Ace-Ser-Leu-NMe at the water–membrane interface. For comparison, the profiles for Ace-Phe-Leu-NMe and Ace-Ser-Leu-NMe are plotted on the left and the right side of the membrane interface, respectively, even though simulations for these dipeptides were carried out independently. For Ace-Phe-Leu-NMe, the densities of the Phe side chain, Leu side chain, backbone N, and O of atoms are plotted in solid black, dashed black, solid red, and dashed red, respectively. For Ace-Ser-Leu-NMe the densities of the Leu side chain, Ser side chain, backbone N, and O atoms are plotted in solid green, dashed green, solid purple, and dashed purple, respectively, and the densities are scaled up by a factor of 50 for better visibility. The densities of water, POPC tail atoms, and POPC headgroup atoms are plotted in brown, solid blue, and dashed blue, respectively.

