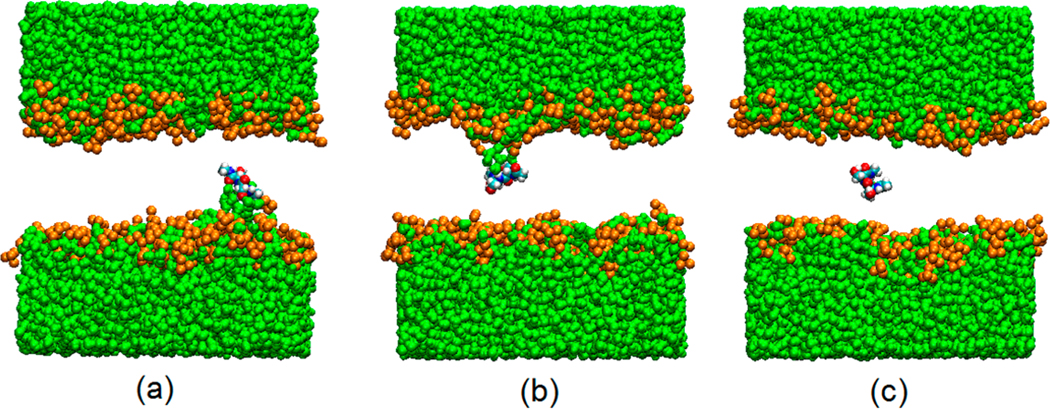
Figure 4.
Snapshot of Ace-Ser-Ser-NMe at positions near the center of the bilayer. Panels a, b, and c represent respectively states S−, S+, and S0. Water finger defects are clearly seen in (a) and (b). Green: water; gold: head groups of POPC lipids (oxygen atoms). Phospholipid tails were removed for clarity.

