
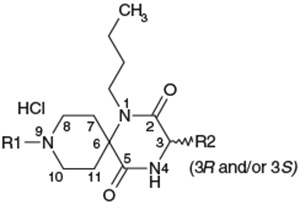
Table 3.
Effect of the 9-N-substituent on activity profiles
 |
||||||
|---|---|---|---|---|---|---|
| Compds | R1 | R2 | C3 Configuration (3R and/or 3S) |
IC50 (nM) Ca assay |
T1/2 in rat liver microsomesa (min) |
Calculated pKab |
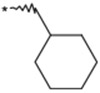
| 17 |  |
 |
(3RS) | 900 | NTc | 7.54 |
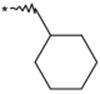
| 18 |  |
 |
(3RS) | 120 | 8.3 | 7.53 |
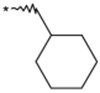
| 19 | 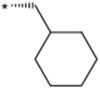 |
(3S) | >3000 | NTc | 7.51 | |
| 20 | 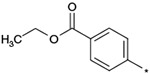 |
 |
(3RS) | >3000 | NTc | 4.12 |
| 21 | 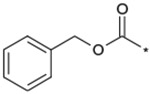 |
 |
(3RS) | 3000 | NTc | 2.52 |
| 22 | 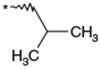 |
(3RS) | 270 | NTc | 8.24 | |
| 1a | 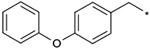 |
 |
(3RS) | 28 | 24 | 7.15 |
| 1b |  |
 |
(3RS) | 94 | 12 | 7.18 |
a
The data show T1/2 after incubating with the 0.2 mg/mL rat liver microsomes.
b
Calculated by ADMET predictor (ver. 4.0).
c
NT: not tested.