Figure 1.

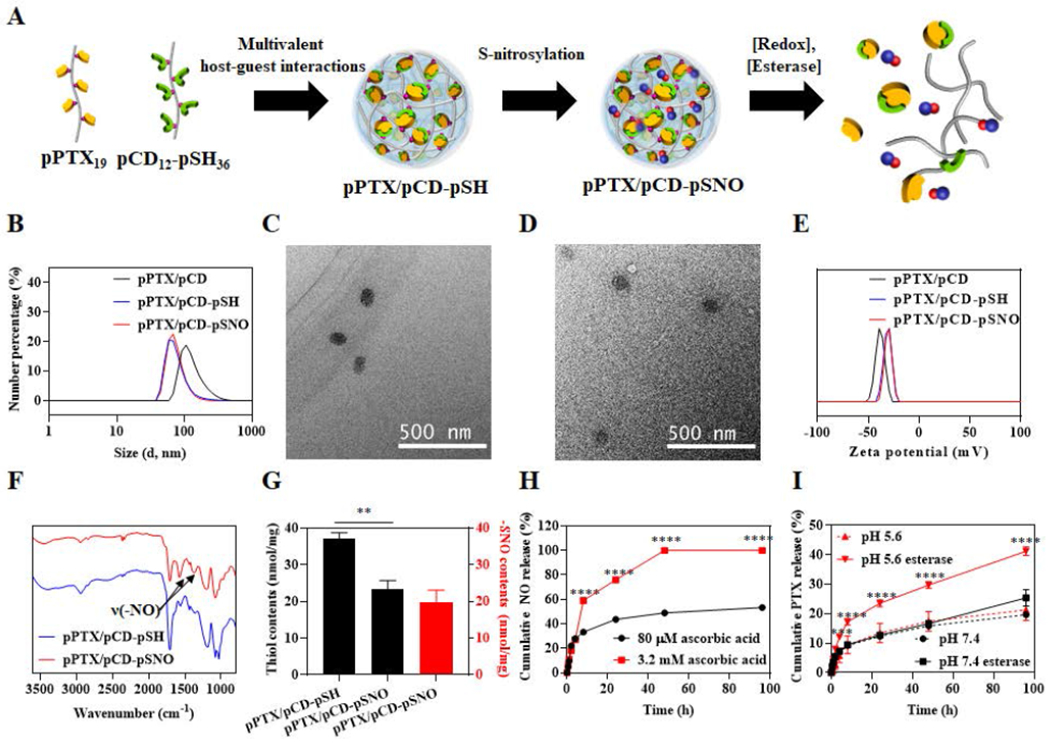
Synthesis and characterizations of pPTX/pCD-pSNO NPs. (A) Schematic of pPTX/pCD-pSNO NP preparation and NO and PTX release mechanisms. (B) Dynamic light scattering (DLS)-based hydrodynamic size distributions of pPTX/pCD, pPTX/pCD-pSH and pPTX/pCD-pSNO NPs. (C) Transmission electron microscopy (TEM) images of pPTX/pCD-pSH NPs. (D) TEM images of pPTX/pCD-pSNO NPs. (E) Zeta potential-based surface charges of pPTX/pCD, pPTX/pCD-pSH and pPTX/pCD-pSNO NPs. (F) FT-IR of pPTX/pCD-pSH and pPTX/pCD-pSNO NPs. (G) Quantification of thiol content of pPTX/pCD-pSH and pPTX/pCD-pSNO NPs by Ellmans’ assay (black box) and quantification of –SNO groups in pPTX/pCD-pSNO NPs by Saville and Griess assays (red box). (H) Cumulative NO release graph under intracellular and extracellular redox conditions. (I) Cumulative PTX release graph at different pH with or without esterase. ****p<0.0001, ***p<0.001, **p<0.01, and *p<0.05.
