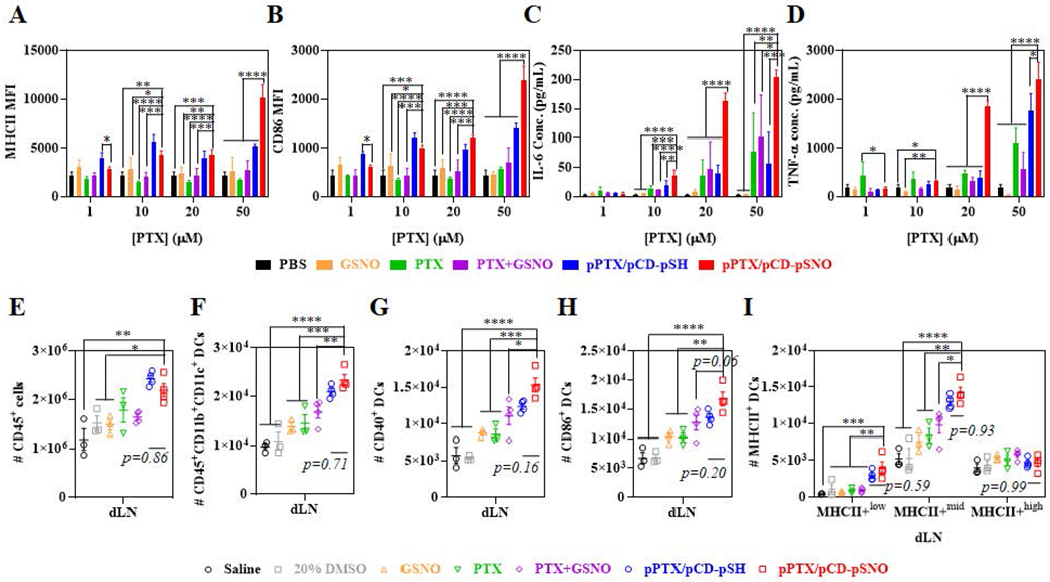
Figure 3. Effects of pPTX/pCD-pSNO NPs on DCs in vitro and in vivo.

Dose dependent in vitro activation of BMDCs, evaluated by (A) MHCII and (B) CD86. Dose dependent in vitro cytokine production by BMDCs, (C) IL-6 and (D) TNF-α. (A-D) The GSNO, PTX+GSNO and pPTX/pCD-pSNO contains 144.5 nM -SNO groups per 1 μM PTX. (E-I) Number of immune cells in draining lymph nodes (dLNs) 1 d after dorsal injection into tumor-free mouse (C57BL/6J); (E) CD45+ cells, (F) CD45+CD11b+CD11c+ DCs, (G) CD40+ activated CD45+CD11b+CD11c+ DCs, (H) CD86+ CD45+CD11b+CD11c+ DCs, and (I) MHCII+low, MHCII+mid, and MHCII+high CD45+CD11b+CD11c+ DCs. ****p<0.0001, ***p<0.001, **p<0.01, and *p<0.05.
