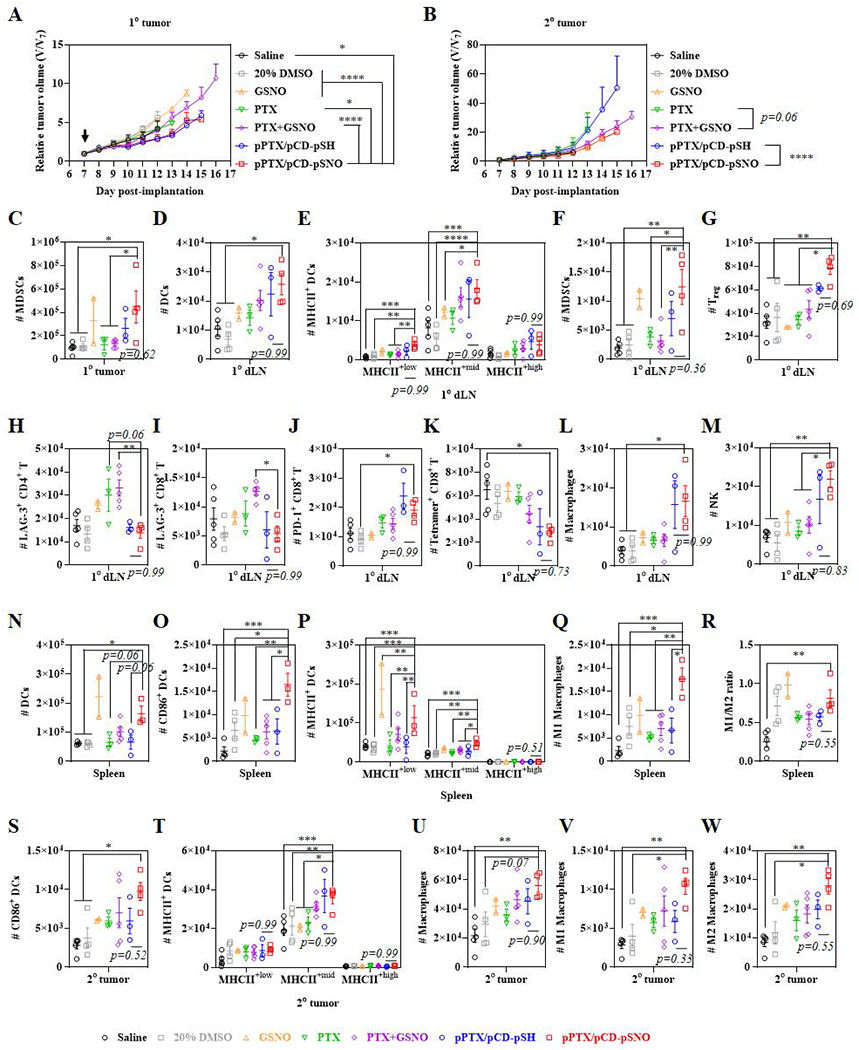
Figure 4. Tumor growth curves and immune cell profiles in various tissues.

Relative tumor size of (A) 1° tumor and (B) 2° tumor after one time i.t. injection. An arrow indicates injection date. Immune cells were profiled 18 d after inoculations of 1° tumors. Number of (C) CD45+CD11b+CD11c−Gr1+ MDSCs in 1° tumor. Number of immune cells in 1° dLN; (D) CD45+CD11b+CD11c+ DCs, (E) MHCII+low, MHCII+mid, and MHCII+high CD45+CD11b+CD11c+ DCs, (F) CD45+CD11b+CD11c−Gr1+ MDSCs, (G) CD45+CD3+CD4+CD25+Foxp3+ Treg, (H) LAG-3+ CD45+CD3+CD4+ T cells, (I) LAG-3+ CD45+CD3+CD8+ T cells, (J) PD-1+ CD45+CD3+CD8+ T cells, (K) Tetramer+ CD45+CD3+CD8+ T cells, (L) CD45+CD11b+F4/80+ macrophages, and (M) CD45+CD3−NK1.1+ NK cells. Number of immune cells in spleen; (N) CD45+CD11b+CD11c+ DCs, (O) CD86+ CD45+CD11b+CD11c+ DCs, (P) MHCII+low, MHCII+mid, and MHCII+high CD45+CD11b+CD11c+ DCs, (Q) CD45+CD11b+F4/80+CD86+ M1 macrophages, and (R) ratio of M1 to M2 (CD45+CD11b+F4/80+CD206+). Number of immune cells in 2° dLN; (S) CD86+ CD45+CD11b+CD11c+ DCs, (T) MHCII+low, MHCII+mid, and MHCII+high CD45+CD11b+CD11c+ DCs, (U) CD45+CD11b+F4/80+ macrophages, (V) CD45+CD11b+F4/80+CD86+ M1 macrophages, and (W) CD45+CD11b+F4/80+CD206+ M2 macrophages. ****p<0.0001, ***p<0.001, **p<0.01, and *p<0.05.
