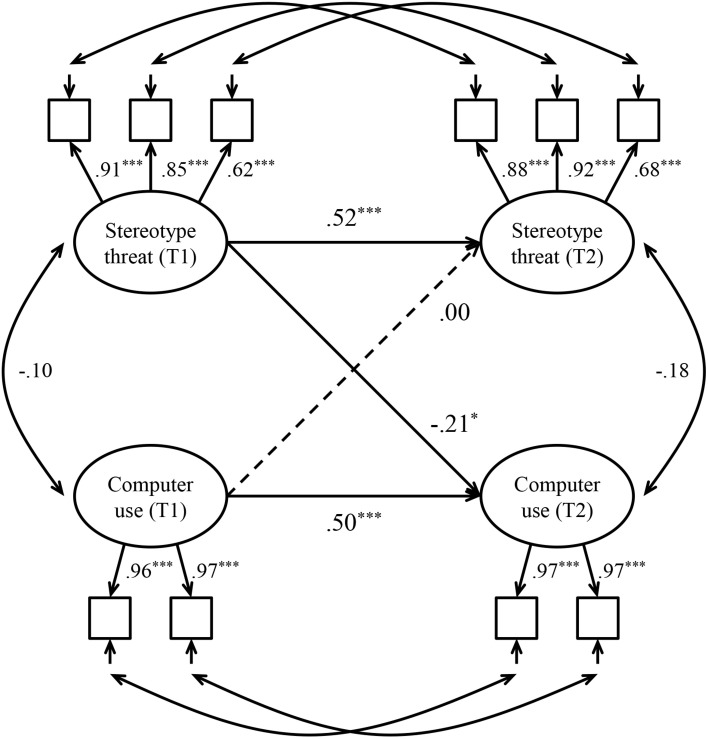
FIGURE 1.
Autoregressive cross-lagged panel model testing the relationship between stereotype threat and computer use. All path coefficients are standardized. Dotted lines indicate non-significant paths. Age, education, sex, living arrangements, occupational status, health status, and computer experience were included as covariates (omitted for clarity). T1 = Time 1, T2 = Time 2. ∗p < 0.05; ∗∗∗p < 0.001.

