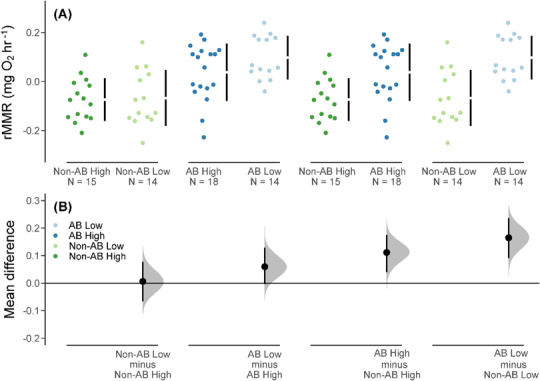
Figure 2.

(A) rMMR values (body mass corrected) for brown trout offspring derived from an anadromous background population (AB) and a non-anadromous background population (non-AB) that were reared under two experimental food treatments: optimal food rations (High) and 25% of optimal daily rations (Low) (black vertical bars represent the SD around the mean (shown as a gap in the bars), and sample size is shown as ‘N =’). (B) Cumming estimation plots for each population background and food treatment combination with effect sizes shown as black dots (i.e. the mean differences in rMMR among the groups), the distributions (shaded curves) and 95% CIs (back bars) of the effect sizes obtained from non-parametric bootstrap resampling (5000 resamples).
