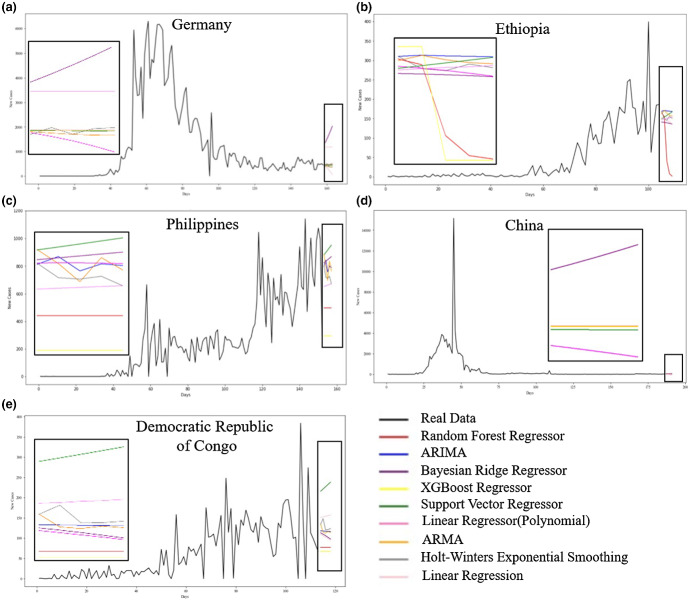
Fig. 3.
Prediction for the next 5 days of the number of patients in different countries where cases are likely to decrease in the coming days using 9 different machine learning algorithms. The black line represents the real data obtained and the rest all colors show predictions using different ML models. The predictions for the countries can be seen more clearly from the snippets. a Prediction plot for Germany.The ARIMA and ARMA models indicate that the count will remain constant for the coming days, whereas XGB shows a decrease in the cases. b Prediction plot for Ethiopia. XGB shows a rapid decline in the number of cases, whereas the ARMA model shows a slight decrease in the curve. c Prediction plot for the Philippines. All the algorithms were inefficient in predicting the highly uneven number of cases seen in the country. d Prediction plot for China. Training the dataset with some specific values, a few algorithms such as LRP and BRR gave inappropriate results. e Prediction plot for the Democratic Republic of Congo. SVR and LRP show an increase in the number of cases

