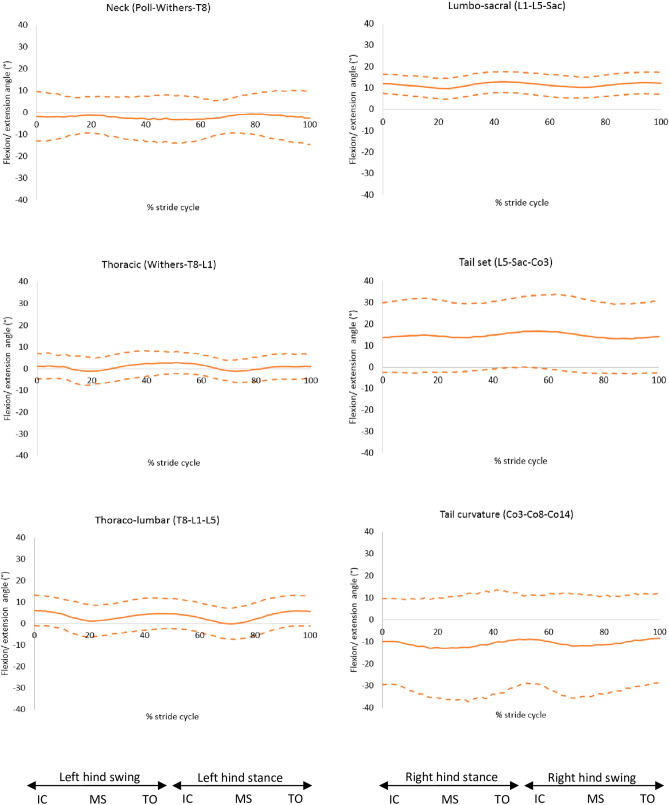
Figure 7.
Flexion (positive) and extension (negative) angles of the back segments, mean of 30 GSDs (solid line) and showing one standard deviation from the mean (dashed lines). Graphs are plotted for one stride cycle, showing initial contact (IC), Mid Stance (MS) and Toe Off (TO) for the left (right hind stance/left hind swing) and right diagonals (left hind stance/right hind swing). Between brackets: marker names (Supplementary material 3, S3).

