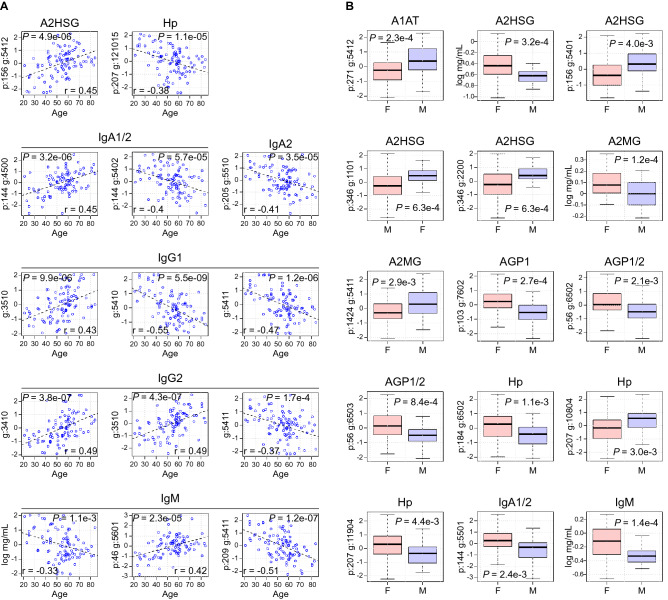
Figure 3.
Effect of Age and Gender on glycosylation. (A) Log relative glycan abundance versus age. Examples of glycoforms significantly altered by age (a full list can be found in Table S4). Of note, IgG1 and IgG2 share several age-associated glycan modifications. Also, glycan 5411 is negatively correlated with age when present on IgG1, IgG2, and position 209 of IgM. IgM also declines with increasing age (P = 0.0011). (B) Representative site-specific glycosylations and proteins that are differentially expressed with respect to gender (a full list can be found in Table S5). The upper and lower bars connected to each box indicate the boundaries of the normal distribution and the upper and lower box edges mark the first and third quartile boundaries within each distribution. The bold line within the box indicates the median value of the distribution. Y-axis represents log relative abundance or log protein concentration where indicated.

