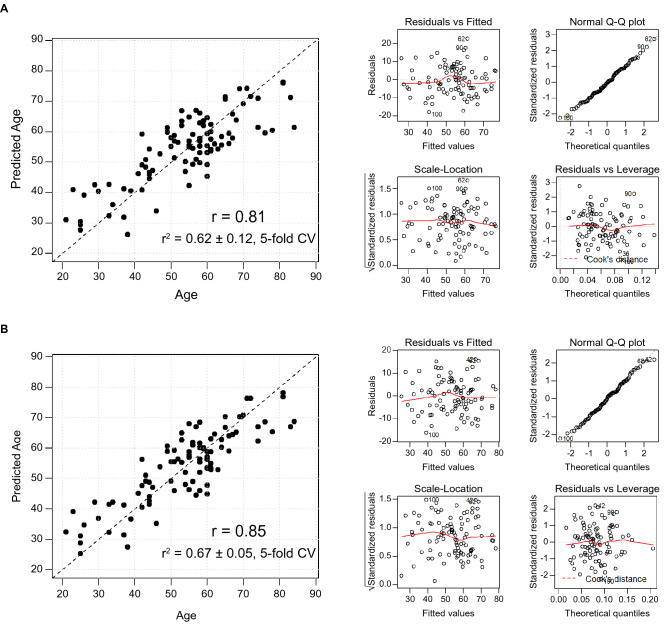
Figure 4.
Age Prediction Models. (A) The graph represents the performance of a linear regression model for age prediction. The model was constructed from 5 different glycopeptides (IgG1 g:3510, IgG1 g:5410, IgM p:209 g:5411, IgM J chain g:5412, Hp p:241 g:7602). Diagnostic plots (residuals vs fitted, testing for linearity; normal Q-Q, to assess the distribution of the residuals; scale-location, to assess the homoscedastic of the data; and residuals vs leverage, to check for overly influential cases) for the model are presented to its right. (B) Linear regression model comprised of six glycopeptides (IgG1 g:3510, IgG1 g:5410, IgG2 g:3410, IgM p:209 g:5411, IgM J chain g:5412, Hp p: 241 g:7602) and 1 serum protein, IgG3. Model diagnostics are represented to the right (model performance parameters for age prediction models can be found in Table S7).

