Figure 5.
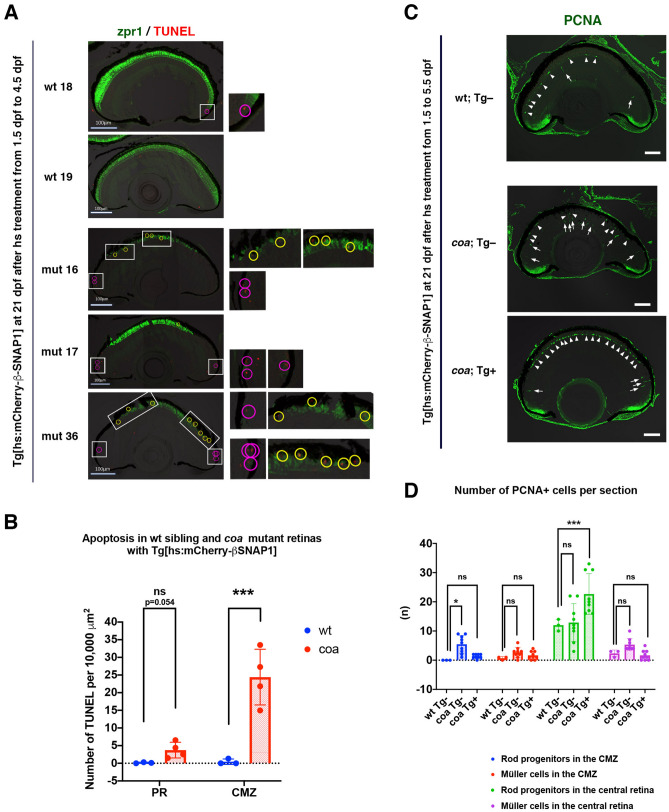
Photoreceptor apoptosis and neuronal regeneration in coa mutants with overexpression of β-SNAP1 during the OS growth period. (A) TUNEL of wild-type and coa mutant retinas with overexpression of β-SNAP1 during the initial OS growth period. Cones are visualized with zpr1 (green). Yellow and red circles indicate TUNEL signals in photoreceptors of central retinas and retinal CMZ, respectively. Higher magnification images of all TUNEL signals indicated by white squares are shown in the right side. Scale: 100 μm. (B) The number of TUNEL-positive cells per 10,000 μm2 in photoreceptors and CMZs of 21-dpf, wild-type siblings and coa mutants with overexpression of β-SNAP1 during the OS growth period. TUNEL density is slightly increased in rescued coa mutant photoreceptors, but does not differ significantly from that of wild-type siblings. On the other hand, TUNEL density in the CMZ is significantly higher in coa mutants than in wild-type siblings. Means ± SD. Two-way ANOVA with Sidak’s multiple comparison test. ***p < 0.005. (C) Anti-PCNA antibody labeling of wild-type and coa mutants with overexpression of β-SNAP1 during the initial OS growth period. Arrowheads and arrows indicate rod progenitor cells and reprogrammed proliferative Müller cells, respectively. Compared with wild-type control (upper), in coa mutants (middle), the number of reprogrammed proliferative Müller cells was increased in the central retina. In coa mutants with overexpression of β-SNAP1 during the initial OS growth period (bottom), the number of rod progenitor cells is markedly increased in the central retina; however, reprogrammed proliferative Müller cells were only observed in the peripheral retina and not in the central retina. Scale: 50 μm. (D) The number of PCNA-positive cells per section. In coa mutants with overexpression of β-SNAP1 during the initial OS growth period, numbers of proliferative Müller cells in both the CMZ (red bars) and the central retina (purple bars) were similar to that of wild type. Rod progenitors in the CMZ were not significantly different from those of wild type (blue bars). Interestingly, rod progenitors in the central retina were twice as numerous as in wild type (green bars). Means ± SD. Two-way ANOVA with the Tukey multiple comparison test. *p < 0.05.

