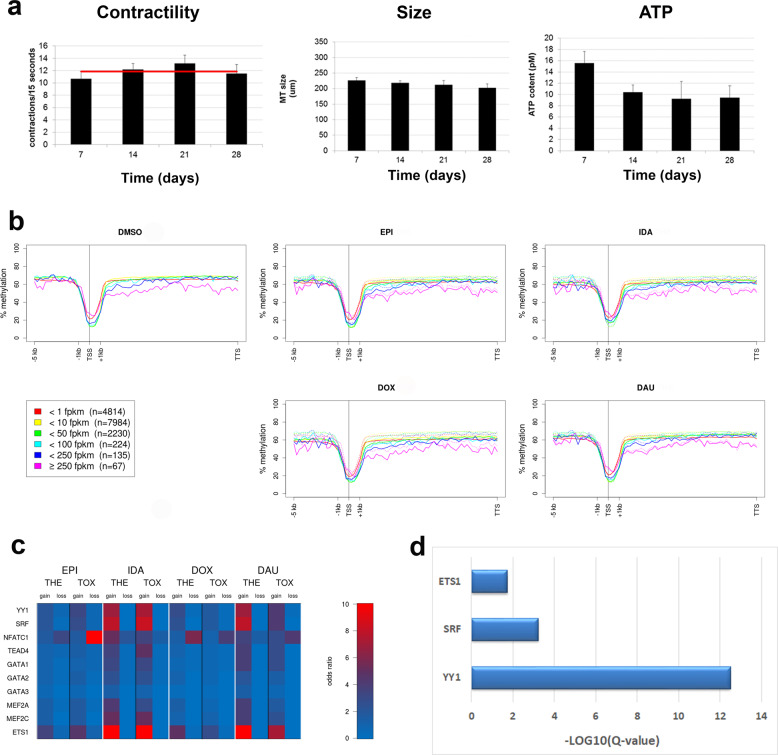
Fig. 1. 3D cardiac microtissues and genome-wide methylation.
a Essential microtissue characteristics remain stable across a time period of 28 days. Contractions per 15 s, microtissue sizes and ATP content. Bars indicate measurements per week. Red line is the average over all 4 weeks. b Inverse correlation of gene body methylation and expression. Genes were classified into six classes of expression strengths based on the median fragments per kilobase of transcript per million reads (FPKM) over all time points and treatments. Methylation values (Y-axes) were averaged for each class of genes according to the following procedure: promoters and gene bodies were binned in 75 windows, 20 bins for the promoter (−5 kb), 1 bin for the transcription start site (TSS), 4 bins for the starting exons/introns (+1 kb) and 50 bins for the rest of the gene body (TTS: transcription termination site); for each gene % methylation in each bin was averaged over all seven time points for the specific treatment and then % methylation was averaged over all genes of the respective expression strength classes. In the plots of the AC-treated experiments the respective curves for the control experiments (DMSO) are shown as dotted lines. X-axes show the prototypical gene structure. TSS: transcription start site, TTS: transcription termination site. c Enrichment of TFBSs of cardiac transcription factors in DMRs that fall into gene promoters. Odds ratios (red = higher than expected) represent the ratio of the observed number of TFBSs that fall into DMRs versus the expected number. d Over-representation of transcription factor target sets in the list of 641 dynamic response proteins (next section). X-axis represents the strength of enrichment, i.e. –log10 of the over-representation Q-value.

