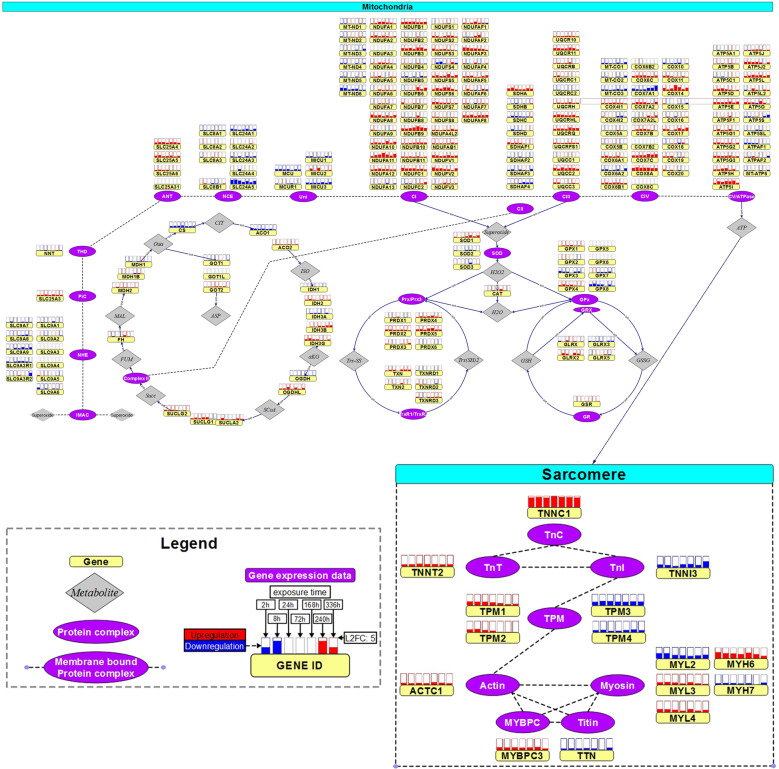
Fig. 3. Dynamic transcriptome changes upon AC treatment in sarcomere and mitochondrion.
Expression changes of mitochondrial response and sarcomere genes upon AC treatment at therapeutic dose measured with RNA-seq (expression changes with respect to toxic doses in Supplementary Fig. 8). Protein complexes are represented by purple, ovals with the genes encoding for subunits displayed next it in yellow rectangles. On top of each gene, the boxes display the expression change over time, where each box corresponds to a specific time point. The fill level of these boxes display the log2 fold change (completely filled boxes: log2 fold change ≥ 5), upregulations are depicted in red and downregulations in blue. Fold-changes were computed from the experimental replicates (n = 3) for each AC against the time-matched control samples. Color-codes refer to the average fold-change of the four ACs at the specific time point. Significance of temporal changes is indicated by transparency, where the lightest genes were not differentially expressed genes (DEGs) in any AC, medium transparent are DEGs with respect to only 1 AC treatment and not transparent are DEGs with respect to at least 2 AC treatments (figure adapted from Verheijen et al. 87).

