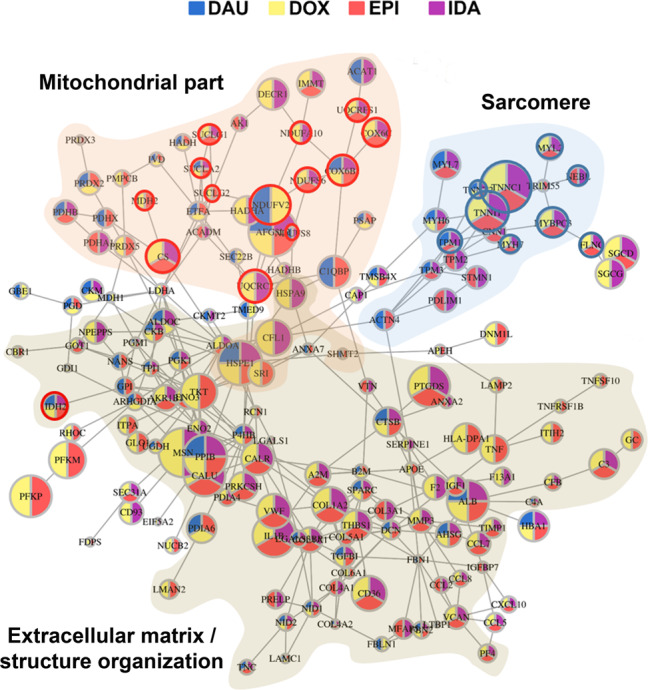
Fig. 4. ACT response network.

ACT response network computed from integrated proteome and transcriptome data (network derived from toxic doses is described in Supplementary Fig. 16). Nodes were initialized based on the significance of the dynamic changes of respective AC treatment compared to DMSO control longitudinal data and for each AC a drug response network was computed (Supplementary Fig. 12). Nodes and their interactions that appeared in at least two of the individual AC networks were integrated. Node colors reflect the occurrence of the node in the individual AC networks. The three major enriched cellular compartments are shown in transparent brown (extracellular matrix), transparent orange (mitochondrial part) and transparent blue (sarcomere). Red circles: Proteins that are contained in the mitochondrial model (Fig. 6a). Blue circles: Proteins genetically associated with dilated cardiomyopathy according to Talay et al.40.
