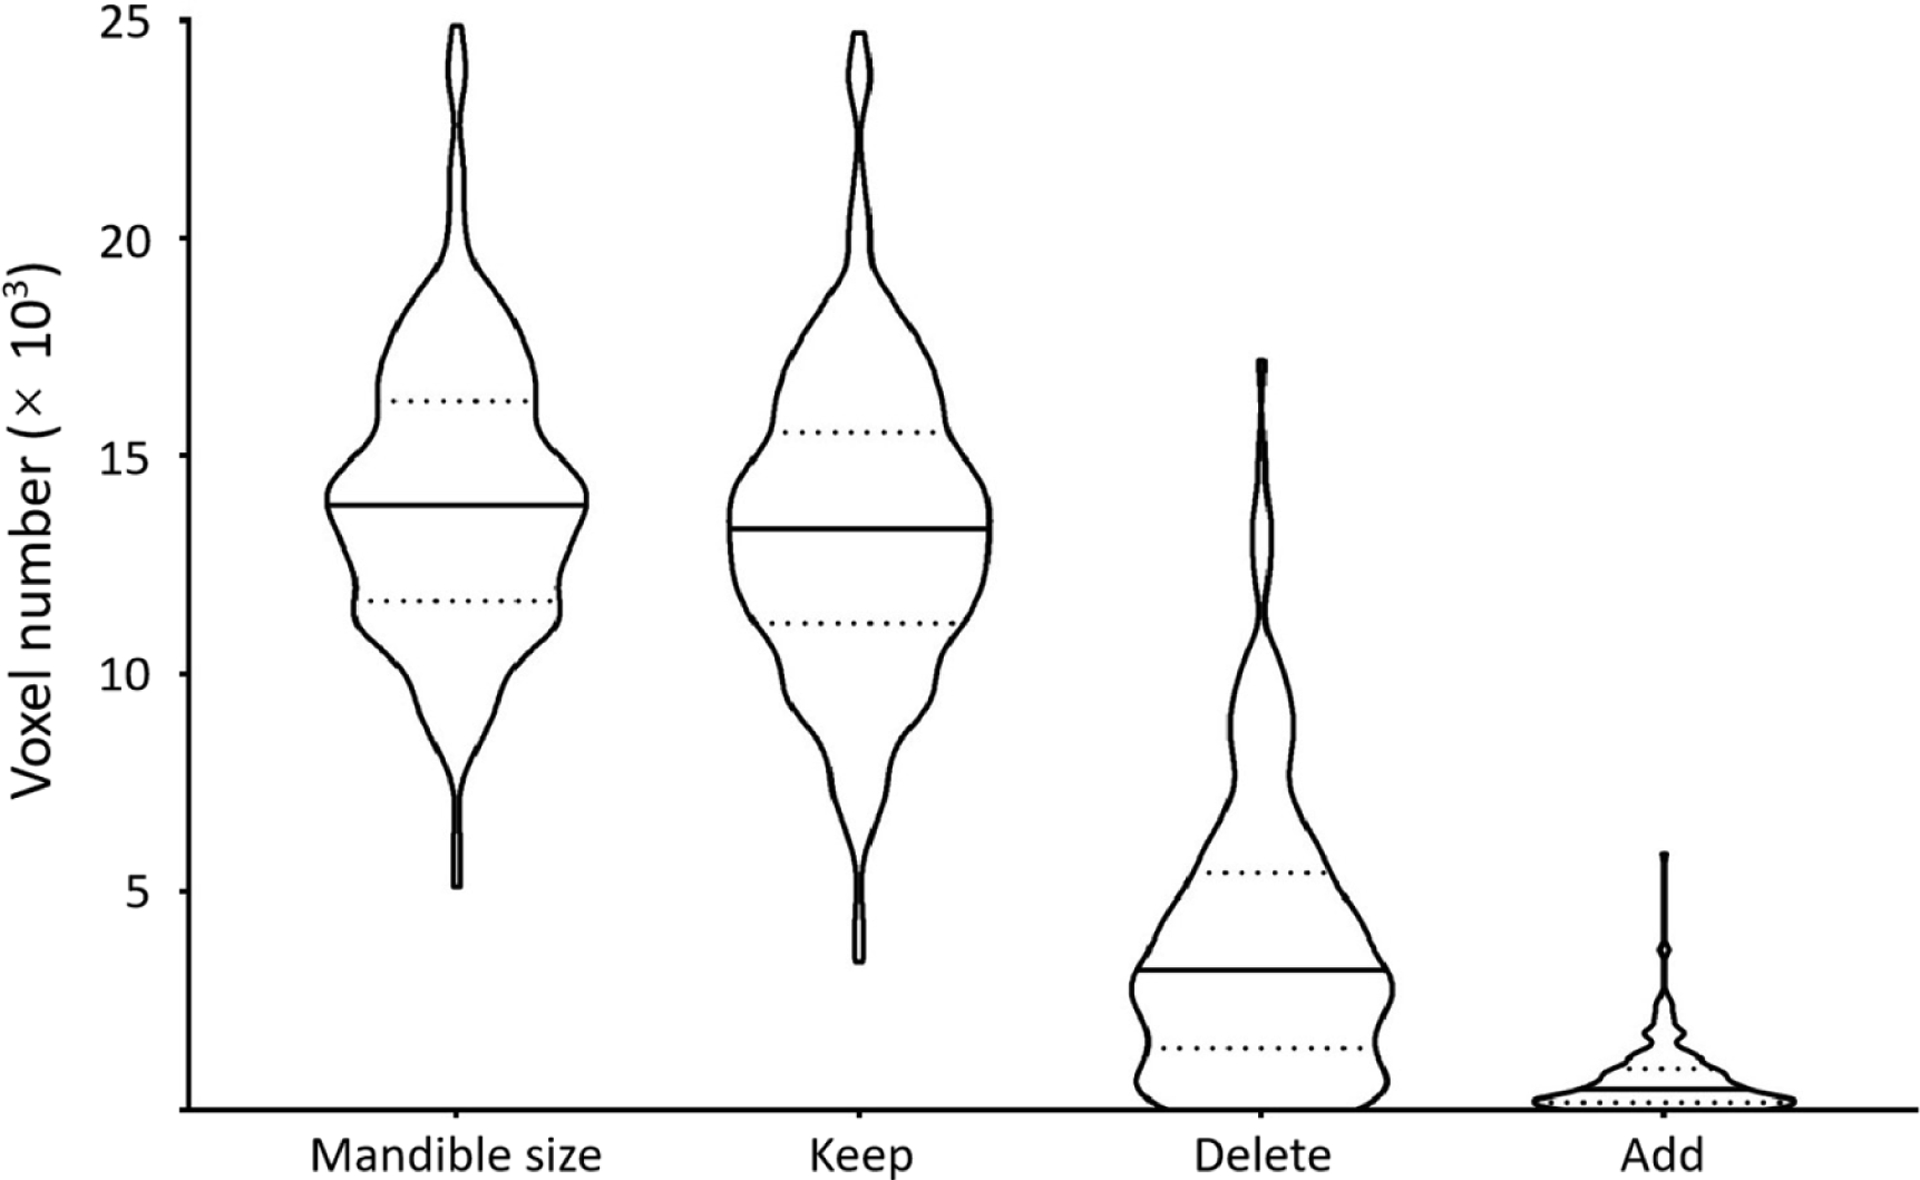
Figure 1.

Voxel number analysis of the mandible regions. In each violin plot, the solid and dotted lines correspond to median and quartile values. It indicates the size of the mandible. Given the reference annotation, it further shows the distributions of the number of voxels kept in, deleted from, and added to the noisy labels in the correction procedure.
