
Figure 5.
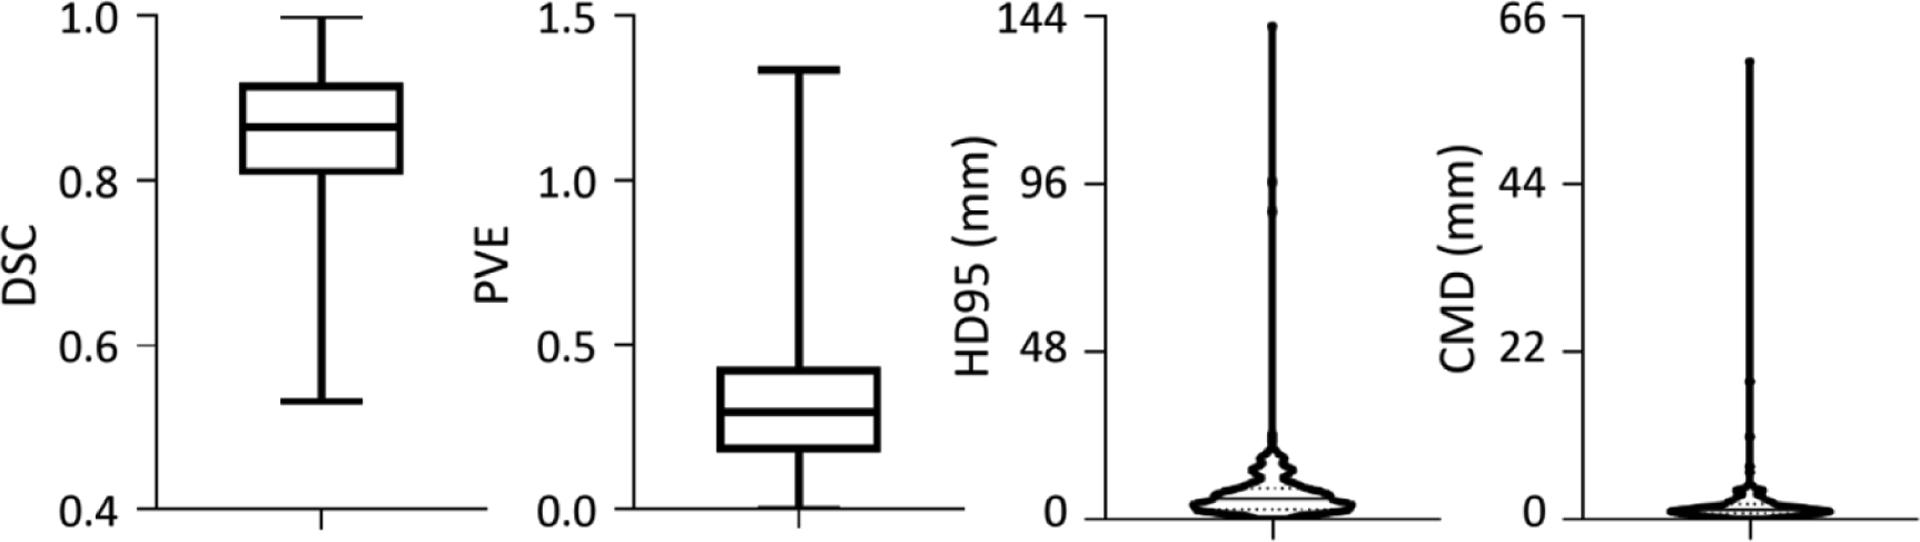
Initial quality of mandible annotation. Given the reference standard, the annotation quality is evaluated from DSC, PVE, HD95 and CMD metrics. The box and whiskers plots show the max, median and min values, and the violin plots shows the median and quartile.