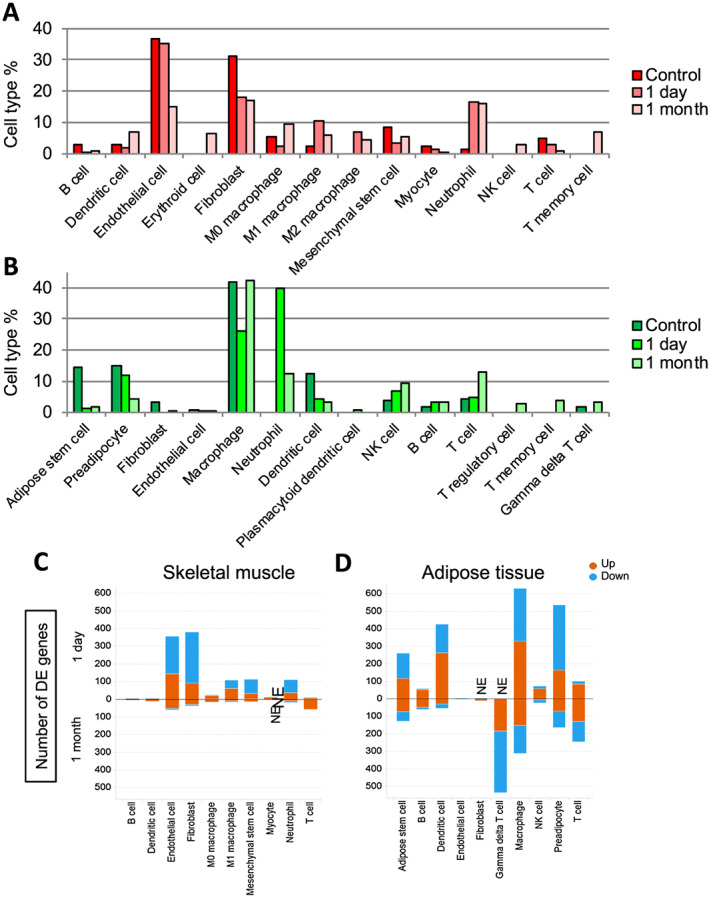
Figure 2.

Comparative analyses of post‐sepsis skeletal muscle‐resident and adipose tissue‐resident cell population abundance and gene expression changes. (A, B) Bar graphs depicting the frequency of each cell type in each sample in skeletal muscle (A) and adipose tissue (B). (C, D) Graphs depicting the number of differentially expressed genes in each cell type compared with control in muscle (C) and adipose tissue (D). Orange = up‐regulated transcripts, and blue = down‐regulated transcripts. NE: cells do not exist.
