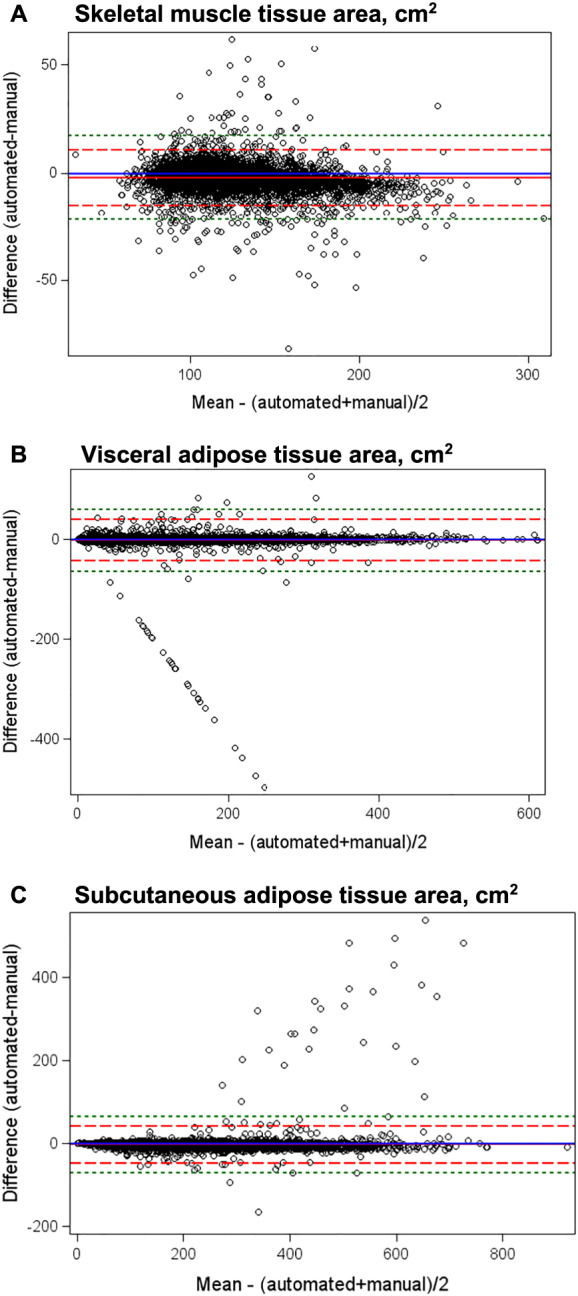
Figure 3.

Bland–Altman plots of mean difference in skeletal muscle and visceral and subcutaneous adipose tissue areas between automated and manual analysis of computed tomography scans. The Bland–Altman plot is a graphical method for assessment of the magnitude of disagreement, both error and bias, between automated and manual segmentation of CT scans. The plot presents the difference versus the average of the automated and manual quantifications of body composition with reference lines at 0 (blue line indicating no difference between the manual and automated methods) and at ±2 standard deviations (SD, the dashed red lines) or ±3 SD (the dashed green lines) of the difference to aid in identification of outliers. Mean differences were −2.35 for muscle, −1.97 for visceral, and −2.38 for subcutaneous adipose tissue. Limits of agreement were broad, with ±2 SD limits of agreement at 10.65 to −15.35 for muscle, 39.55 to −43.44 for visceral, and 42.98 to −47.72 for subcutaneous adipose tissue and ±3 SD limits of agreement at 17.15 to −21.85 for muscle, 60.30 to −64.19 for visceral, and 65.65 to −70.39 for subcutaneous adipose tissue.
