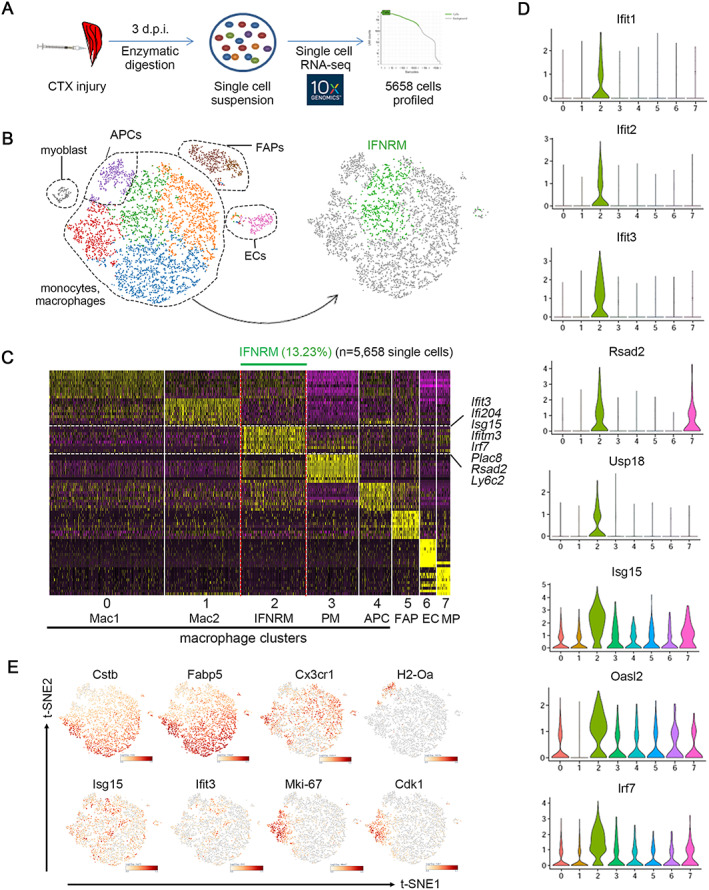
FIGURE 3.

Single‐cell RNA‐seq mapping reveals a unique interferon‐responsive macrophage cluster (IFNRM) in injured young muscle. (A). Cells isolated from injured (3 days) young muscle were used for library preparation of single‐cell RNA sequence, and 5658 quality control‐positive cells was used to further analysis. (B) Data (with each dot representing a single cell) are displayed as colour‐coded clusters on a t‐SNE plot. In the macrophage sub‐cluster, the IFNRM cluster shown in green is defined on the basis that most of the top differentiation expressed marker genes of this cluster were IRGs. (C) Heatmap plotting the top 10 differentiation expressed marker genes for each macrophage sub‐cluster (y axis) versus single cells grouped by cluster (x axis). The IFNRM population is indicated at the top of the heat map, and selected marker genes are annotated on the right (purple and yellow indicate low and high expression levels, respectively). (D) Violin plots depicting the expression probability distribution for each single‐cell cluster. Eight IRGs are shown. (E) t‐SNE visualization overlaid with the expression of Cstb, Fabp5, Cx3cr1, H2‐Oa, Isg15, Ifit3, Mki‐67, Cdk1. t‐SNE, t‐distributed stochastic neighbour embedding. IRGs, interferon‐responsive genes.
