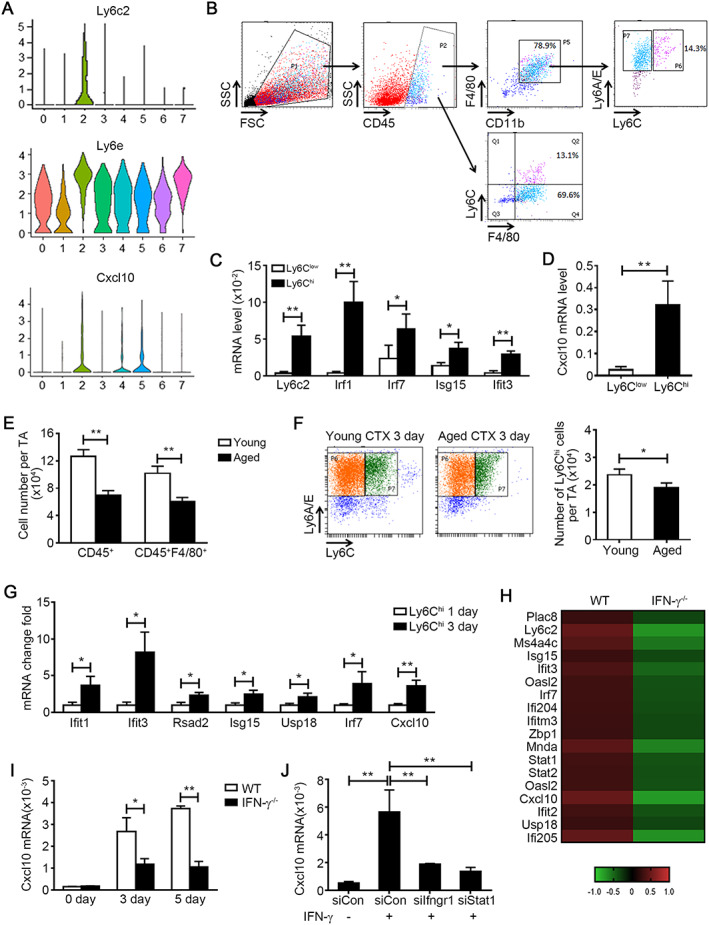
FIGURE 4.

Interferon‐gamma (IFN‐γ) stimulates interferon‐responsive macrophage cluster (IFNRM) to produce a secretory cytokine CXCL10 specifically. (A) Violin plots depicting the expression distribution of membrane protein gene Ly6c2, Ly6e, and secreted protein gene Cxcl10 in each cell cluster. (B) Representation of gating strategy for sorting the Ly6E+Ly6Chi and Ly6E+Ly6Clow macrophage from young muscle at 1 and 3 days after injury. (C) The expression levels of Ly6c2 and other IRGs (Irf1, Irf7, Isg15, and Ifit3) in sorted cells were analysed by real‐time PCR (n = 3 per group). (D) The expression levels of Cxcl10 in sorted cells were analysed by real‐time PCR (n = 3 per group). (E and F) The number of CD45+ leucocytes, CD45+F4/80+ macrophages (E) and Ly6E+Ly6Chi IFNRM (F) per tibialis anterior (TA) muscle from young and aged mouse were accessed by flow cytometry at 3 days after injury (n = 4 per group). (G) The expression levels of (IFNRM) signature genes (Ifit3, Ifit1, Rsad2, Isg15, Usp18, Irf7, and Cxcl10) in Ly6Chi macrophages sorted from muscle at 1 day and 3 days after injury were accessed by real‐time PCR (n = 3 per group). (H) F4/80+ macrophages were sorted from WT and IFN‐γ−/− muscle at 3 days after injury. Then the transcription profile was analysed by RNA‐seq. Heatmap demonstrates the normalized expression level of the top differentiation expressed marker genes of IFNRM cluster in WT and IFN‐γ−/− macrophages. The gene expression levels were normalized against mean expression values of each gene in all samples. (I) the mRNA level of Cxcl10 in WT and IFN‐γ−/− muscle at 0, 3, and 5 days after injury was accessed by real‐time PCR (n = 4 per group). (J) Bone marrow derived macrophage was pre‐treated with control siRNA, Ifngr1 siRNA, or Stat1 siRNA, and then recombinant IFN‐g was added to the culture medium for 24 h. The mRNA level of Cxcl10 in macrophages was accessed by real‐time PCR (n = 4 per group). Data represent the mean ± SEM. *P < 0.05 and **P < 0.01, by two‐tailed Student's t‐test.
