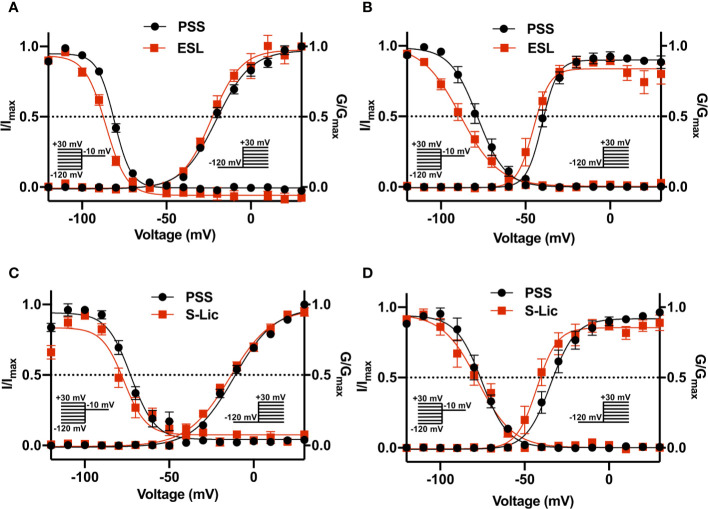
Figure 5.
Effect of eslicarbazepine acetate and S-licarbazepine on activation and steady-state inactivation. (A) Activation and steady-state inactivation in MDA-MB-231 cells in physiological saline solution (PSS; black circles) and in eslicarbazepine acetate (ESL; 300 μM; red squares). (B) Activation and steady-state inactivation in HEK-Nav1.5 cells in PSS (black circles) and ESL (300 μM; red squares). (C) Activation and steady-state inactivation in MDA-MB-231 cells in PSS (black circles) and S-licarbazepine (S-Lic; 300 μM; red squares). (D) Activation and steady-state inactivation in HEK-Nav1.5 cells in PSS (black circles) and S-Lic (300 μM; red squares). For activation, normalized conductance (G/Gmax) was calculated from the current data and plotted as a function of voltage. For steady-state inactivation, normalized current (I/Imax), elicited by 50 ms test pulses at -10 mV following 250 ms conditioning voltage pulses between -120 and +30 mV, applied from a holding potential of -120 mV, was plotted as a function of the prepulse voltage. Results are mean ± SEM (n = 7–13). Activation and inactivation curves are fitted with Boltzmann functions.

