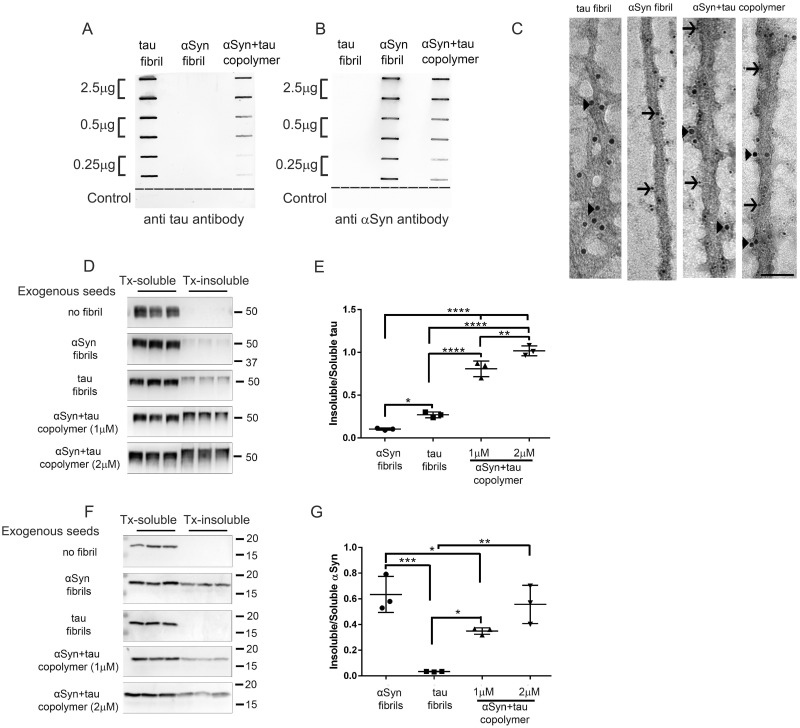
Figure 1.
Tau and αSyn copolymerized fibrils potentiate tau seeding in cell culture. (A–C) Characterization of human K18 tau fibril, human αSyn fibril and tau+αSyn copolymer preparations used in this study by slot blotting and immuno-EM. Selected amounts (µg) of aggregated proteins, as indicated on the left panel, were transferred onto two identical nitrocellulose membranes and were probed with an antibody raised against total tau (A) or an antibody raised against total αSyn (B). The control row consists of two consecutive slots coated with buffer and a third slot (to the far right) coated with 2.5 µg of bovine serum albumin protein (A, B). The fibrillar preparations were examined using immuno-EM following simultaneous incubation of the aggregates with 10 nm gold particle conjugated total tau antibody (indicated by arrowheads) and 6 nm gold particle conjugated αSyn antibody (indicated by arrows) (C). The tau+αSyn copolymers display immunoreactivity to both tau and αSyn specific antibodies. Scale Bar, 50 nm. To ascertain the seeding activity of different aggregates, HEK293T cells were transfected with plasmids expressing human P301L tau (D, E) or human WT αSyn (F, G) and treated with αSyn fibril, K18 tau fibril or tau+αSyn copolymer as indicated. Two different doses of tau+αSyn copolymers were used in both experiments. Cells were biochemically fractionated into Triton-soluble and Triton-insoluble fractions. Western blots depicting Triton-soluble and Triton-insoluble levels of tau (D) or αSyn (F) in seeded HEK293T cells. The molecular weights are designated in the right side of the western blots and type of exogenous seeds added depicted on the left. Quantification of Triton-insoluble tau levels normalized to Triton-soluble tau levels of the corresponding sample was done using ImageJ (E, G). Three experimental replicates are shown here. Full-length blots are presented in Supplementary Fig. 2B–C. One-way ANOVA with Tukey’s post hoc analysis. *P < 0.05, **P < 0.01, ***P < 0.001, ****P < 0.0001.

