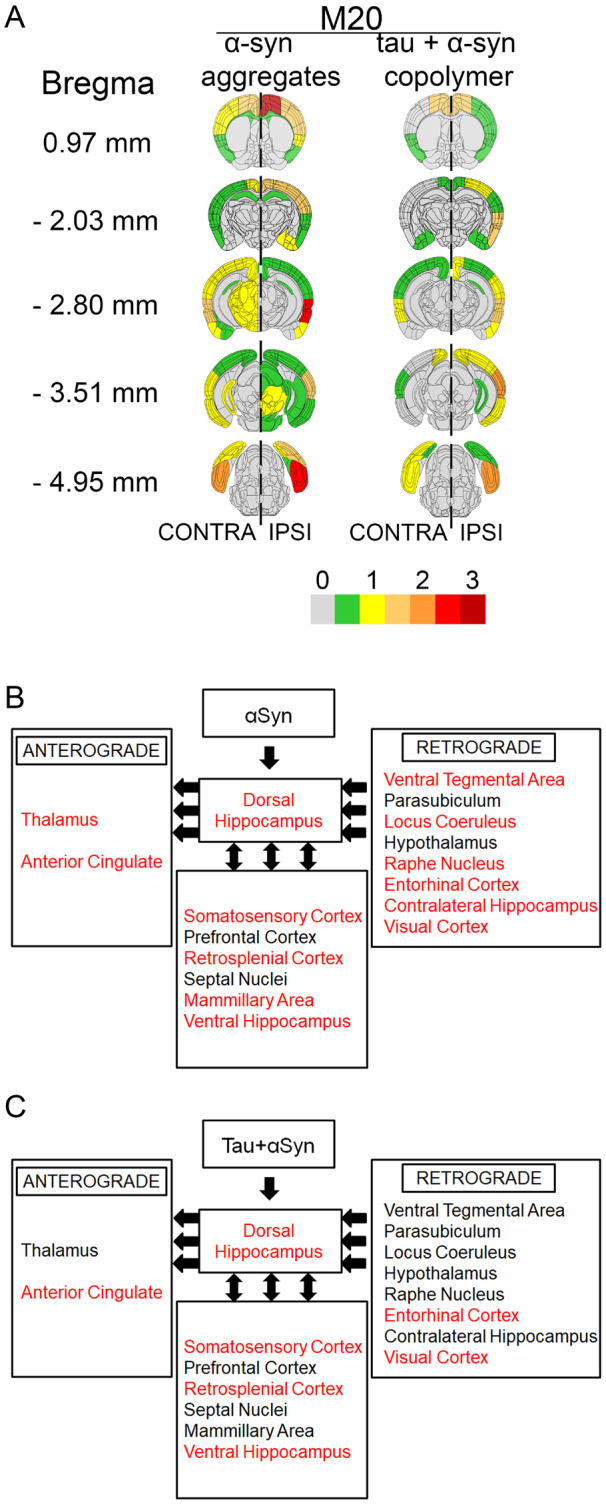
Figure 6.

Seeding with tau + αSyn copolymers lead to reduced distribution of αSyn pathology compared to αSyn fibrils injected M20 mice. Semi-quantitative analyses of pathological burden in M20 mice was done by assigning pSer129 αSyn pathology (81A immunoreactivity) intensity on a scale of 0 (no pathology) to 3 (high pathology) which was then colour-coded onto heat maps (A). The key to heat map scores is provided at the bottom of the figure. The ipsilateral (‘IPSI’) side is shown on the right and contralateral (‘CONTRA’) side is depicted on the left with a dotted line demarcating the central axis. Five coronal planes are shown from top to bottom: bregma 0.97, −2.03, −2.80, −3.51 and −4.95 mm. Scores were averaged between mice for each group. The ipsilateral side is shown on the right and contralateral side is depicted on the left. (B, C) Diagrams show different brain regions neuroanatomically connected to the dorsal hippocampus via anterograde or retrograde pathways (left-pointed arrows) or both pathways (double-headed arrows). Brain regions showing pSer129 αSyn pathology are indicated. Red text indicates brain regions showing pαSyn pathology and black text indicates regions showing no detectable pαSyn pathology. (B) The relative neuroanatomic distribution of pαSyn pathology in αSyn fibril-injected mice and (C) shows the same for tau+αSyn copolymer-injected mice. For graphical representation of the neuropathology scores, see Supplementary Fig. 10A–D; for representative images of stained brain areas, see Supplementary Fig. 9B. n = 4 mice/group.
