. 2020 Jul 30;9(7):3682–3687. doi: 10.4103/jfmpc.jfmpc_293_20
Copyright: © 2020 Journal of Family Medicine and Primary Care
This is an open access journal, and articles are distributed under the terms of the Creative Commons Attribution-NonCommercial-ShareAlike 4.0 License, which allows others to remix, tweak, and build upon the work non-commercially, as long as appropriate credit is given and the new creations are licensed under the identical terms.
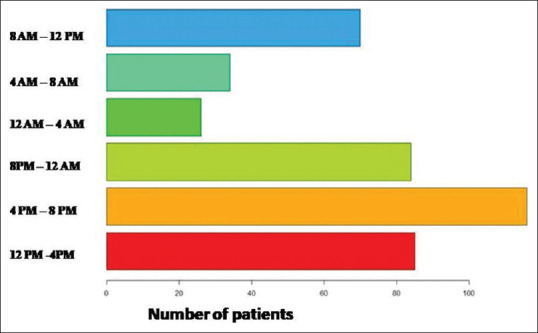
Figure 3.

Bar diagram depicting the time of injury of RTA victims
