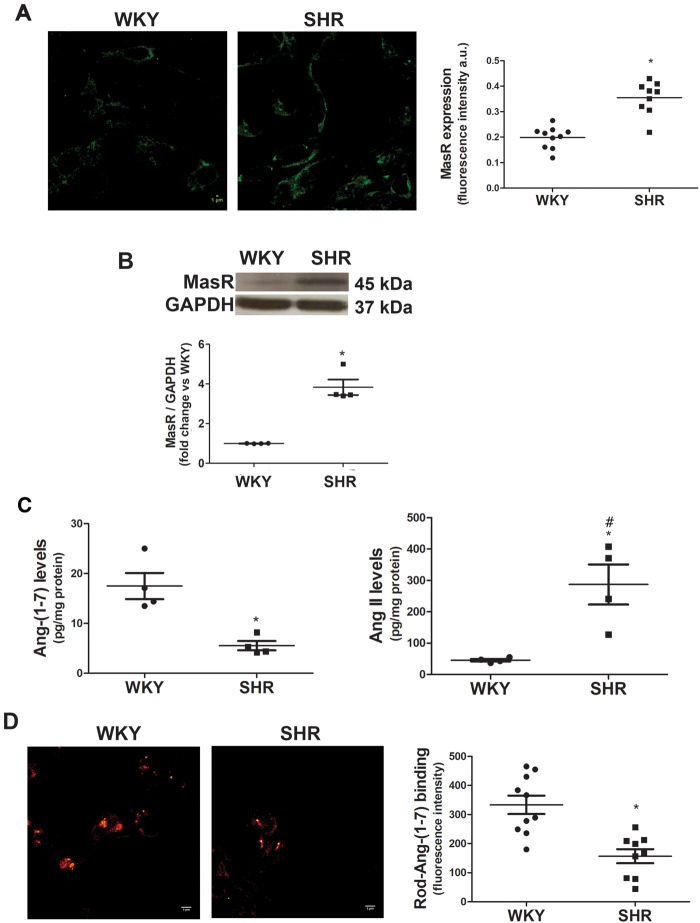
Figure 1.
MasR expression is increased while Ang-(1-7) endogenous levels and binding are decreased in SHR brainstem neurons. (A) MasR expression measured by immunofluorescence. Representative images of MasR immunostaining (scale bar = 5 µm) and quantification of MasR immunofluorescence in brainstem neurons from WKY and SHR (four to five images were analysed per independent neuronal culture; n = 4 independent neuronal cultures). Results were expressed as fluorescence intensity per cell (a.u.). (B) MasR expression measured by western blot (n = 4 independent neuronal cultures). A representative blot is presented. (C) Endogenous Ang-(1-7) and Ang II levels measured by radioimmunoassay (n = 4 independent neuronal cultures). Results are expressed as pg/mg protein. Data on Ang-(1-7) and Ang II levels were presented in separate graphs to make the difference in Ang-(1-7) levels in both strains be easily seen, although the statistical analysis was performed with all the data. (D) Representative images of Rhod-Ang-(1-7) binding and quantification of Ang-(1-7) binding expressed as fluorescence intensity per cell (a.u.) (four images were obtained per culture, n = 3 independent neuronal cultures). The line in each scatter plot shows the mean ± SEM from independent neuronal cultures. WKY and SHR neuronal cultures were obtained in parallel. Each experiment was carried out with 500 000 cells (A and D) and eight million cells (B and C). Scale bar = 5 µm. *P < 0.05 compared with the WKY group (Mann–Whitney non-parametric test or Kruskal–Wallis non-parametric tests followed by Dunn’s multiple comparison test in C); #P < 0.05 compared with Ang-(1-7) levels in WKY (one-way analysis of variance).

