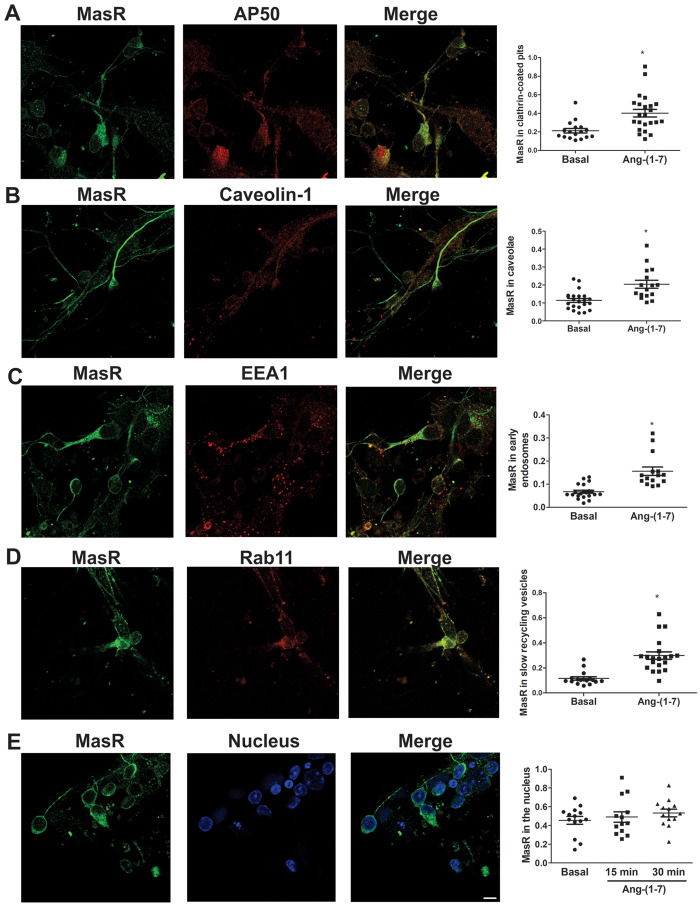
Figure 5.
MasR displays the same trafficking in neurons from SD rats as those from WKY rats. Representative images of immunostaining of MasR (green) and the CCP marker AP50 (red; A), the caveolin marker (red; B), the early endosome marker EEA1 (red; C), the slow recycling vesicle marker Rab11 (red; D) or the nuclear marker Hoechst (blue; E) in brainstem neurons from WKY rats and SHRs stimulated with Ang-(1-7) for 15 min (A–C) or 30 min (D and E). Scale bar = 5 µm. Right graphs represent quantification of MasR colocalization with each marker in brainstem neurons from WKY rats and SHRs incubated in the absence (basal) or the presence of Ang-(1-7) for 15 min (A–C), 30 min (D), or 15 and 30 min (E). The line represents the mean ± SEM of the ratio between the signals from MasR and the corresponding marker. Four independent experiments were analysed (four to five images per experiment). Experiments were carried out with 500 000 cells for each condition. *P < 0.05 vs. basal (Mann–Whitney non-parametric test for A–D; Kruskal–Wallis non-parametric tests followed by Dunn’s multiple comparison tests for E).

