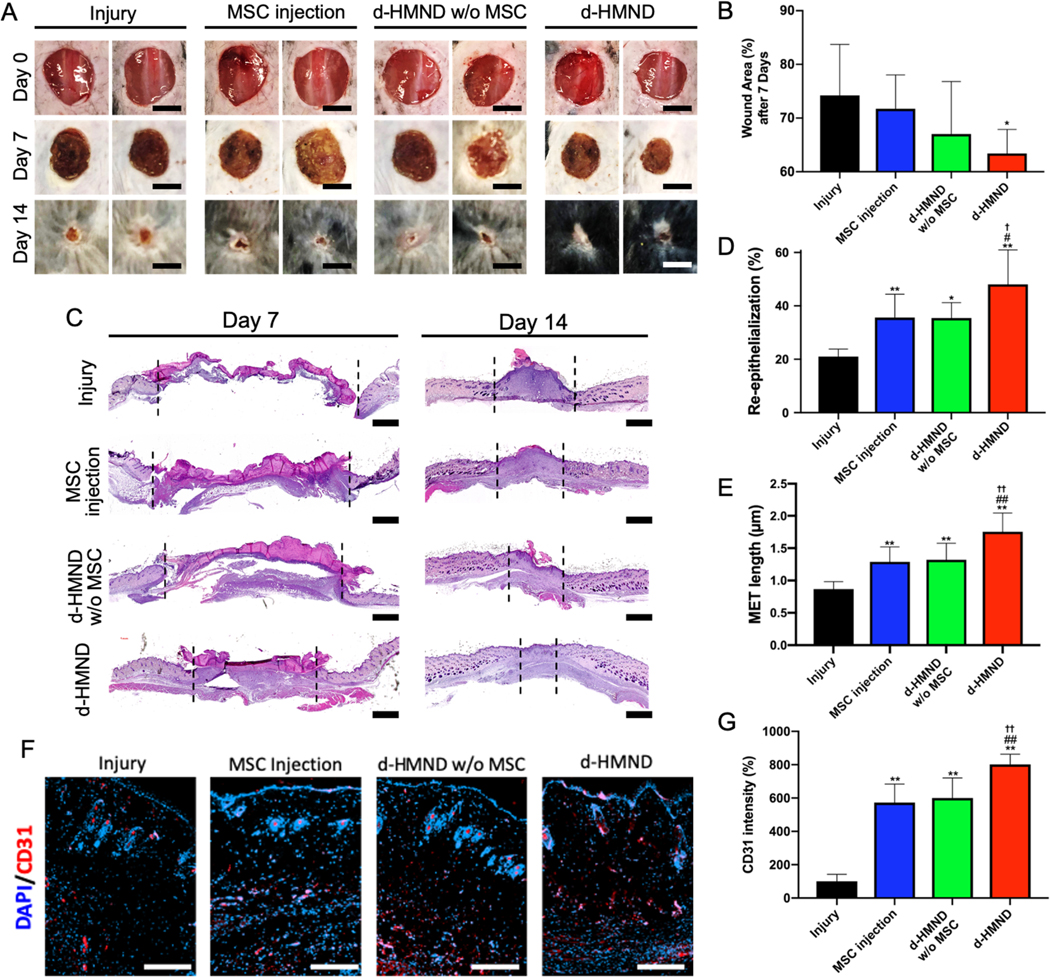
Figure 6.
(A) Images of wound healing in different experimental groups: untreated (control), MSC-injected, d-HMND without MSCs, and d-HMND with MSCs. (Scale bars = 10 mm). (B) Wound area of each group after 1 week. (C) Representative histologic images of wound bed treated by each method at days 7 and 14. (Scale bars = 1 mm). (D) Re-epithelialization after 2 weeks. (E) MET length after 2 weeks. (F) Representative immunofluorescence images of the wound edge treated by each method each day. (Scale bars = 200 μm). (G) Quantitative analysis of CD 31 positive area. *p < 0.05 and **p < 0.01, compared with Injury group. #p < 0.05 and ##p < 0.01, compared with MSC injection group. †p < 0.05 and ††p < 0.01, compared with d-HMND w/o MSC group. All data are presented as the mean ± SD.

