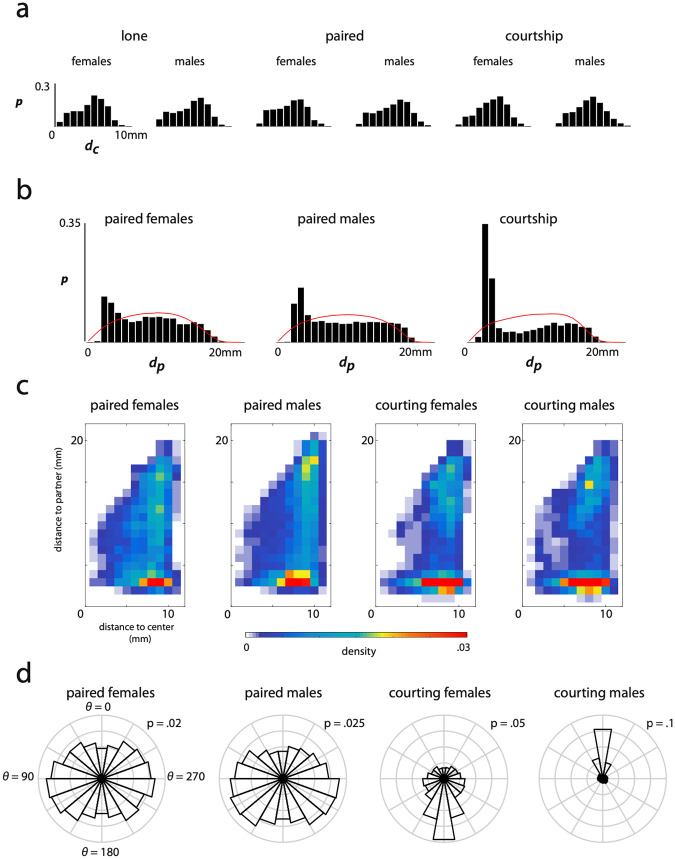
Fig 2. Distance and angle within the arena and to partner by behavioral context.
Histograms of distance to the center of the arena, distance to partner, and heading to partner are plotted where applicable. a) The fraction of time individuals from each context reside in ten equal-area concentric circles radiating from the center of the arena outwards. b) Histogram of the distance between paired individuals for all individuals in a given context. The red line indicates the expected distribution of distances between random points within the arena. c) 2-dimensional histogram of residence time in each paired context broken down by distance from the center of the arena (x-axis) and distance to the interaction partner (y-axis). d) Radial histogram, p(θ), of the heading of an individual given a context in relation to the centroid of the arena partner where θ = 0 refers to heading directly toward the interaction partner. Bins each represent a 20° angular range. The value of the outer ring is labeled in each radial histogram as they are scaled differently.

