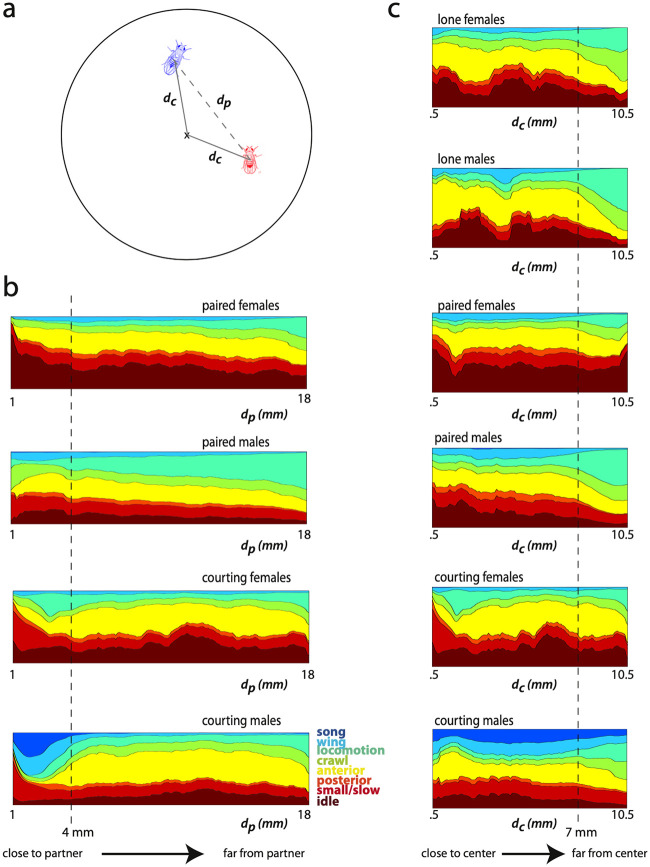
Fig 4. Fly behavior by radial position in the arena across context.
a) Illustration of distances dp and dc given a pair of flies in the arena. b) Stacked behavioral density plots show the frequency of each coarse behavior given distance to the interaction partner dp. A sliding window of 1 mm was used to calculate density at.1 mm increments with centers ranging from.1 to 18 mm. A stacked plot is shown for each paired condition. Color corresponds to the coarse behavior labels. c) Stacked behavioral density plots show the frequency of each coarse behavior binned in 1 mm radial windows centered at the distance dc from .5 to 7 mm. A stacked plot is shown for each experimental condition, where color corresponds to behavioral frequency at each radial position in the experimental arena. The dashed line indicates a radial distance of 7 mm.

