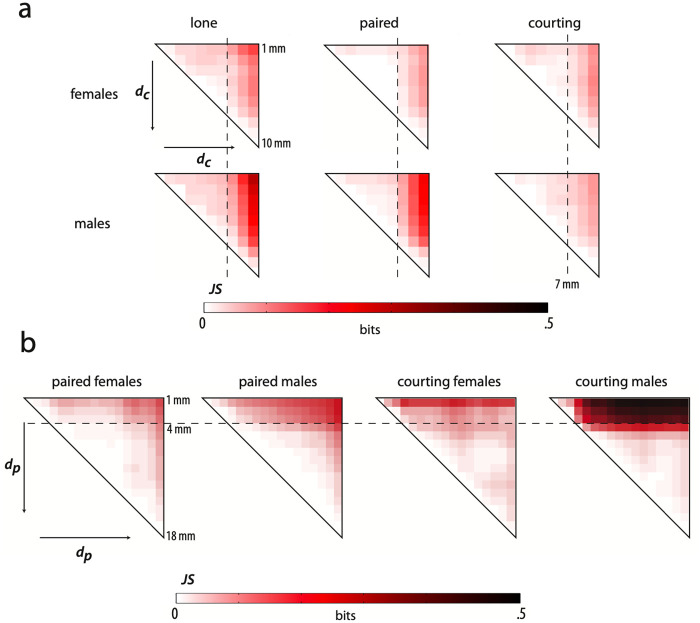
Fig 5. Changes in overall behavior as a function of distance to the arena center and the partner.
a) Comparison of behavioral density maps generated for each context given 1 mm bins of distance to the center of the arena. A behavioral map is generated for each context given the behavior of individuals at a specific 1 mm window of distance to the center of the arena. The JS divergence is computed between each map within a context, and the upper right section of the resulting matrix is displayed. The dashed line in each matrix indicates a radial distance of 7 mm b) A comparison of density maps for overlapping 2 mm bins of distance to partner is generated in the same manner as in (a) and the JS divergence between each map in a given context is displayed. The dashed line in each matrix indicates a partner distance of 4 mm.

