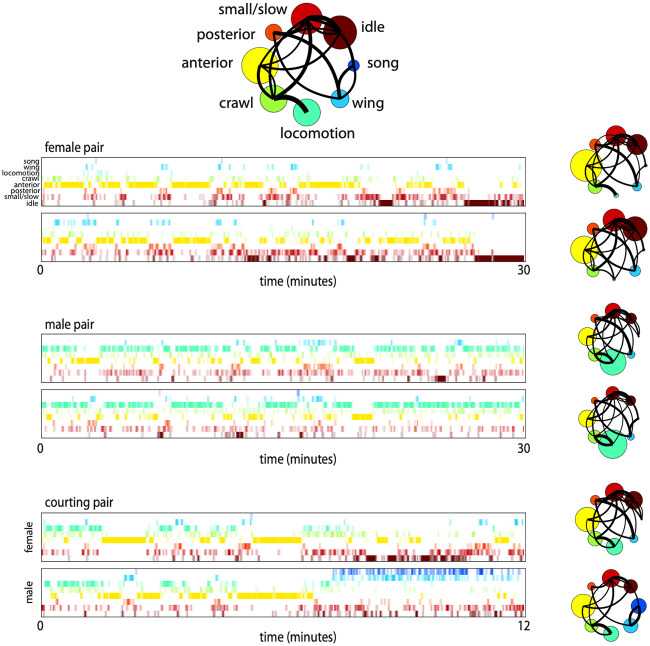
Fig 8. Sample ethograms and behavioral densities for fly pairs during simultaneous behavior.
Ethograms for pairs of flies in each of the paired conditions are shown along with coarse behavioral densities for each individual. Colors and ordering used correspond to the coarse behavioral labels introduced in Fig 3 and replicated at the top for reference. Samples were chosen from experiments in the top quartile of synchronization. The switch to song behaviors in the male in the courtship example is representative of courtship samples where copulation was reached before the end of recording.

