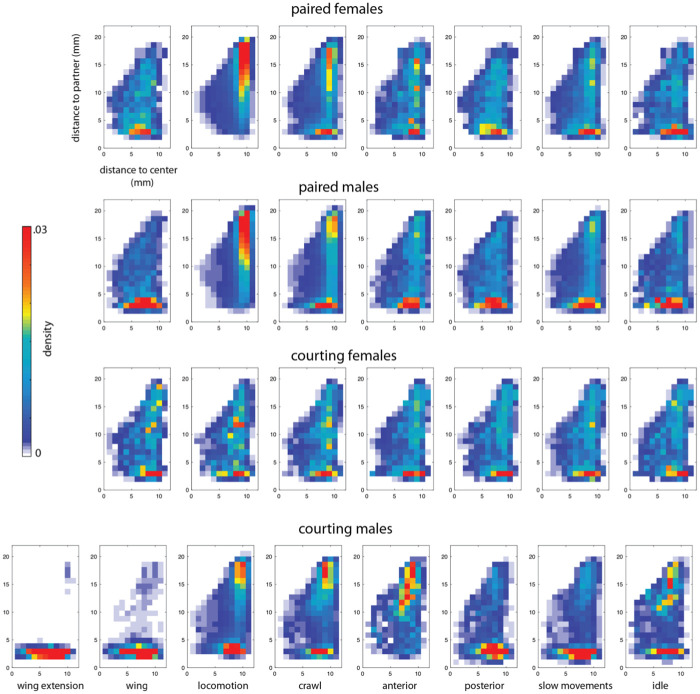
Fig 9. Location in the arena a behavior is performed depends on context.
For each of eight behaviors (columns) for each paired context (rows), the 2-dimensional histogram of residence time in each paired context is broken down by distance from the center of the arena (x-axis) and distance to the interaction partner (y-axis). Each heat map summarizes where an individual was in the arena and relation to the interaction partner when performing a particular behavior.

