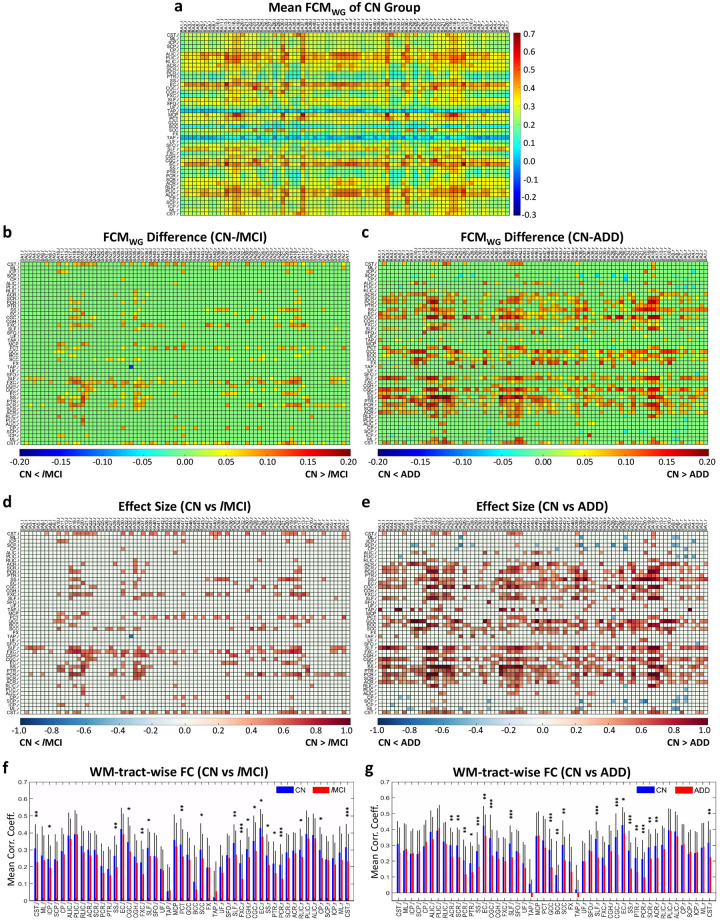
Fig 1. Significant differences in mean FCMWG (mFCMWG) and WM-tract-wise FC between controls (CN) and patients with lMCI or ADD.
(a) mFCMWG of CN group. (b, c) Difference of subtracting mFCMWG of lMCI (b) or ADD (c) from mFCMWG of CN group. The P-value for each element was derived from permutation-test (10,000 permutations) across all participants within groups, and then adjusted using an FDR. Those elements with PFDR >0.05 were set to be zero. (d, e) Effect size of the mFCMWG difference between CN and lMCI (d) or ADD (e), thresholded by PFDR. (f, g) GM-averaged correlation coefficients of WM tracts, i.e., WM-tract-wise FC, in CN group (blue) and lMCI group (red) (f) and in CN group (blue) and ADD group (red) (g). Mean and standard deviation of each WM-tract-wise FC are shown, and * indicates p <0.05, ** indicates p<0.01 and *** indicates p<0.001, calculated by unpaired-sample t-test.

