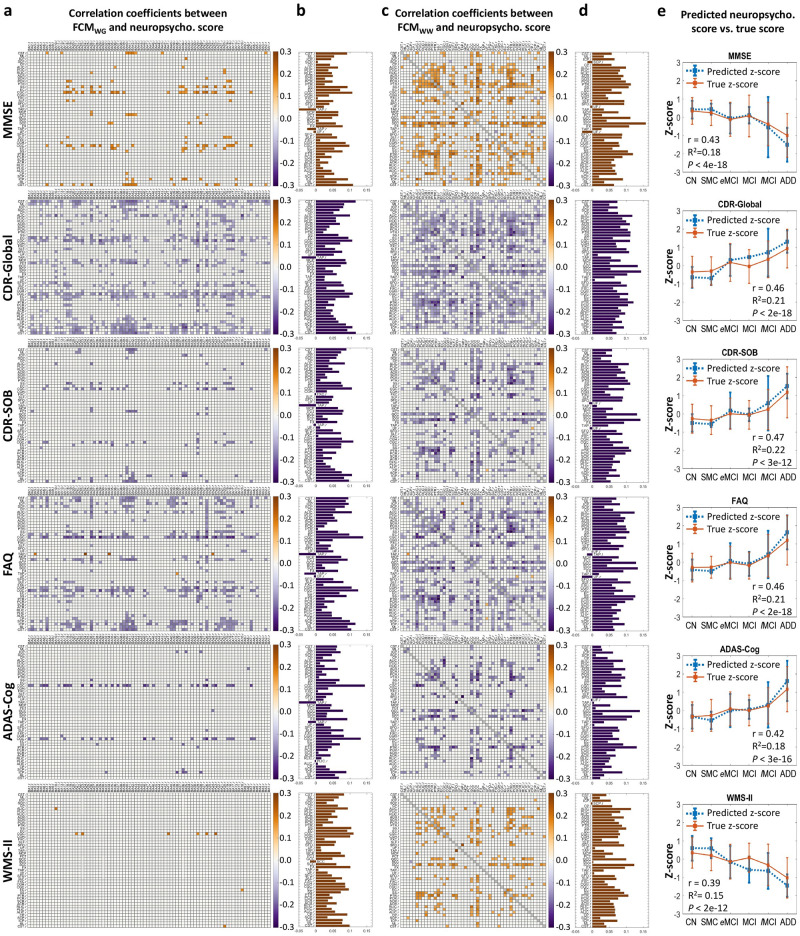
Fig 4. Correlations between WM FC and neuropsychological scores across all subjects.
(a or c) Matrix of Pearson’s correlation coefficients between single element in FCMWG or FCMWW and MMSE score, CDR-Global score, CDR-SOB score, FAQ score, ADAS-Cog score, or WMS-LMII score. Each correlation coefficient with PFDR > 0.05 was set to be zero. (b or d) Average of correlation coefficients along each WM tract in a or c. See Table 1 for the lists of WM and GM ROIs. (e) Group means and standard deviations of Z-scores of true neuropsychological scores and predicted scores using RF regression model with all WM FC as initial features. The r, R2 and P in each plot are the Pearson’s correlation coefficient between true scores and predicted scores across all subjects, R-square value and P-value, respectively.

