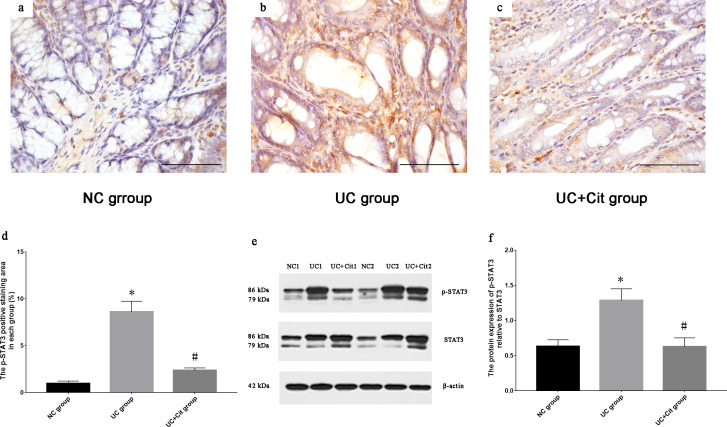
Fig 4. Comparison of phosphorylation of STAT3 in colon tissues of each group.
Immunohistochemically staining for p-STAT3 in colon tissues of NC group (a), UC group (b) and UC+Cit group (c) (×400). The p-STAT3 positive staining area (%) in UC group was significantly larger than that in NC group (*P<0.05 vs. NC group), and the p-STAT3 positive staining area (%) in UC+Cit group was significantly smaller than that in UC group (#P<0.05 vs. UC group) (d). The expression of p-STAT3 protein relative to STAT3 protein was determined by western blot analysis (e). Expression of p-STAT3 protein in colon tissues of UC group was significantly higher than that of NC group (*P<0.05 vs. NC group), and expression of p-STAT3 protein in UC+Cit group was significantly lower than that of UC group (#P<0.05 vs. UC group) (f).

