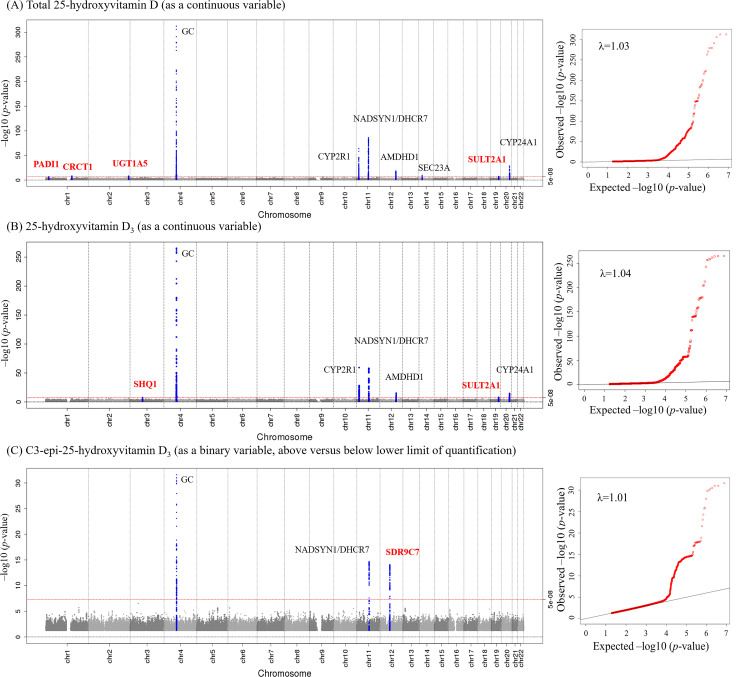
Fig 2. Genome-wide association of circulating 25-hydroxyvitamin D metabolites: Manhattan plot and quantile–quantile plot of all genetic variants from the meta-analysis.
Manhattan plot and quantile–quantile plot for each of total 25-hydroxyvitamin D (A), 25-hydroxyvitamin D3 (B), and C3-epi-25-hydroxyvitamin D3 (C). Manhattan plot (left): SNPs are plotted on the x-axis according to their positions on each chromosome. The red line indicates the threshold for genome-wide significance (p < 5 × 10⁻⁸). Blue points represent SNPs in the ±100-kb region of a top hit. Loci are annotated with the gene names closest to the SNPs with lowest p-values (red indicates novel loci identified in the present study). Quantile–quantile plot (right): The x-axis shows the expected −log10 p-values, and the y-axis shows the observed −log10 p-values. Each SNP is plotted as a red dot, and the black line indicates the null hypothesis of no true association.

